Article-at-a-Glance: Streamline Kubernetes Administration
Discover the transformative power of k9s CLI for Kubernetes cluster management.
Learn how to install k9s on various operating systems and connect it to your cluster.
Explore basic commands for cluster navigation and resource management.
Understand how to monitor cluster health and view logs in real-time.
Customize k9s with command shortcuts, key binds, and plugins for an enhanced experience.
When it comes to managing Kubernetes clusters, efficiency is key. You want to get your tasks done quickly and accurately, and that’s where k9s CLI comes into play. It’s like having a Swiss Army knife for your Kubernetes clusters, offering a range of tools and features that simplify your workflow. But before we dive into the nitty-gritty of commands and configurations, let’s understand what makes k9s a game changer in the world of Kubernetes management.
Why k9s CLI is a Game Changer for Kubernetes Management
If you’ve ever found yourself lost in a sea of kubectl commands or struggled to keep track of your cluster’s health, you’re not alone. Kubernetes is powerful, but it can also be complex. That’s where k9s steps in. It provides a terminal-based user interface that streamlines the way you interact with your Kubernetes clusters. With k9s, you can view, manage, and troubleshoot your clusters with ease, all from the comfort of your terminal window.
Most importantly, k9s is designed to be intuitive. It takes the standard cluster management commands you’re already familiar with and enhances them with a visual interface and additional functionality. This means you can perform complex tasks with fewer keystrokes and less guesswork.
Experience Efficiency in Cluster Maintenance
With k9s, you’re not just managing your clusters; you’re doing it more efficiently. The terminal UI is optimized for quick navigation and real-time updates, so you’re always in the loop about what’s happening in your cluster. Plus, with its responsive design, k9s adapts to your terminal’s size, giving you as much information as your screen can handle.
Key Features That Set k9s Apart
k9s isn’t just another CLI tool; it’s packed with features that set it apart, such as its ability to streamline Kubernetes restart deployment processes.
Real-time monitoring: Track the real-time metrics and activities of your resources, all updated live.
Log streaming: View live log streams from your pods, making it easier to debug issues on the fly.
Resource management: Easily manage different resource types, from deployments to custom resource definitions.
Quick navigation: Use keyboard shortcuts and command aliases for speedy traversal through your cluster’s resources.
Plugin support: Extend k9s’s functionality with plugins, tailoring it to your specific needs.
Now that you’re familiar with what k9s can do, let’s get you set up so you can start managing your clusters with style. For a more comprehensive understanding of managing deployments, you might want to check out this Kubernetes deployment guide.
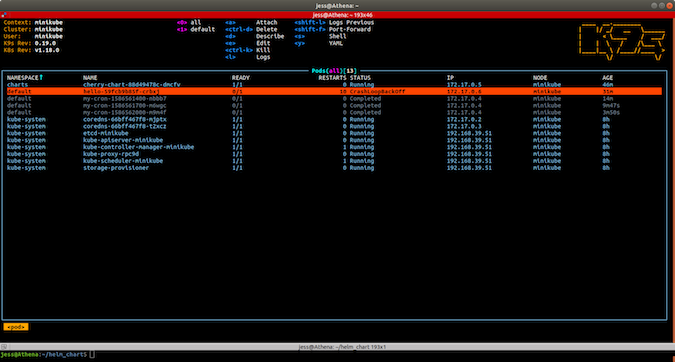
“Kubernetes clusters with k9s …” from opensource.com and used with no modifications.
Getting Started with k9s CLI
Getting k9s up and running is a breeze, and I’ll walk you through it step by step. First, you’ll need to install k9s. Then, you’ll connect it to your Kubernetes cluster. Finally, you’ll learn the basic commands to navigate and manage your cluster resources.
Installation on Various Operating Systems
Whether you’re using MacOS, Windows, or Linux, k9s has got you covered. You can install k9s using package managers like Homebrew for MacOS, Chocolatey for Windows, or a simple binary download that works on any system. For Linux users, you might find our guide on setting up a local cluster with Podman Kubernetes particularly useful. Here’s a quick rundown:
On MacOS, use the command:
brew install derailed/k9s/k9sFor Windows, try:
choco install k9sAnd on Linux, you can usually download the binary and make it executable with a couple of commands.
Once you’ve installed k9s, it’s time to connect it to your Kubernetes cluster.
Connecting k9s CLI to Your Kubernetes Cluster
k9s leverages your existing kubeconfig file to connect to your clusters. This means if you’ve been using kubectl, you’re already set to go. Just fire up k9s in your terminal, and it will automatically use your default context to connect to your cluster. If you need to switch contexts, that’s just a keystroke away.
Now, let’s get comfortable with navigating around your cluster using k9s.
Basic Commands to Navigate Your Cluster
Once you’re in the k9s interface, you’ll find yourself in the default namespace view. Here’s where the magic begins. You can quickly switch between namespaces, view your workloads, and inspect the health of your cluster. The following commands are your bread and butter:
:namespace– Switch between namespaces.:pod– View and manage pods.:deploy– See deployment details.:svc– Explore your services.
Use the arrow keys to move around and enter to drill down into the details of each resource. It’s that easy.
Viewing Cluster Details with k9s
Seeing the bigger picture is crucial, and k9s provides an overview of your cluster resources right out of the gate. You’ll see CPU and memory usage, pod status, and more. This overview is invaluable for keeping an eye on the health and performance of your cluster.
But k9s isn’t just for observation; it’s for action. When you spot something that needs your attention, you’re only a few keystrokes away from taking the necessary steps to address it.
Easy Traversal of Kubernetes Resources
Navigating Kubernetes resources with k9s feels like a walk in the park. You can jump from viewing pod logs to editing deployment YAML files in a flash. And if you’re looking for something specific, the built-in search feature comes in handy. Just type a few characters, and k9s will filter the resources for you.
Stay tuned for the next part where we’ll dive into advanced cluster operations, customizing your k9s experience, and much more. You’ll be managing your Kubernetes clusters with such finesse that you’ll wonder how you ever got by without k9s.
Customizing Your k9s Experience
Customization is the spice of life, especially when it comes to tooling. k9s understands this and provides ample opportunities to tailor the experience to your preferences. Let’s dive into how you can make k9s your own, with command shortcuts, key binds, and plugins.
By customizing k9s, you not only enhance its functionality but also increase your productivity. You’ll spend less time typing and more time doing. It’s about working smarter, not harder.
Creating Your Own Command Shortcuts and Key Binds
Imagine you have a set of commands you use frequently. Wouldn’t it be nice to have them at your fingertips? k9s allows you to define your own command shortcuts and key binds in a configuration file. This means you can execute complex sequences with just a few keystrokes.
To create custom shortcuts, you’ll edit the k9s configuration file, which is typically located at ~/.k9s/config.yml. You can assign new key bindings to existing commands or even create your own command sequences. This feature is a massive time-saver for repetitive tasks.
Extending Utility with Plugins
Plugins are a powerful way to extend k9s’s capabilities. They enable you to add new commands and functionality that are specific to your workflow. Whether you need to integrate with other tools or automate a complex task, there’s probably a plugin for that.
Installing plugins is straightforward. You simply place the plugin executable in your PATH and define the plugin in your k9s configuration file. From there, you can invoke your plugin commands directly from within the k9s interface.
Monitoring Cluster Health in Real-Time
Keeping a watchful eye on your Kubernetes cluster’s health is essential. With k9s, you get real-time insights into your cluster’s performance and resource utilization. This real-time monitoring means you can quickly identify and respond to issues before they escalate. For more detailed guidance, check out our Kubernetes deployment guide which can help you understand strategies and tips for maintaining a healthy cluster.
The dashboard view in k9s is where you’ll find a wealth of information, including CPU, memory usage, and node status. It’s like having a command center for your cluster, giving you the power to monitor and manage everything in one place.
Interpreting Kubernetes Cluster Metrics
Understanding your cluster’s metrics is key to maintaining a healthy system. k9s provides a comprehensive set of metrics that help you gauge the state of your cluster. You can see metrics for nodes, pods, and containers, all updated in real-time.
But it’s not just about having the data; it’s about understanding what it means. k9s presents this information in an accessible way, so you can make informed decisions about scaling, resource allocation, and troubleshooting.
Setting Up Alerts and Notifications
While k9s does not natively support alerts, you can integrate it with external monitoring solutions. By setting up alerts and notifications through these solutions, you can be proactively informed of any issues in your cluster, whether you’re actively watching the k9s dashboard or not.
This integration ensures that you’re always in the loop, even when you’re not at your terminal. You can focus on your work, knowing that you’ll be notified if your Kubernetes cluster needs attention.
Managing Resources Like a Pro
Effective resource management is the cornerstone of a well-functioning Kubernetes cluster. k9s gives you the tools to manage your resources like a pro, with features that help you understand and set resource requests and limits, and scale your applications dynamically.
Understanding Resource Requests and Limits
Kubernetes uses resource requests and limits to manage how much CPU and memory each container can use. With k9s, you can view and edit these settings directly, ensuring that your applications have the resources they need to perform optimally, without over-provisioning.
Example: To change the resource requests for a pod, you would navigate to the pod view in k9s, select the pod, and press
eto edit its YAML configuration. Here, you can adjust therequestsandlimitsunder the container specifications.
Adjusting these values can help prevent resource contention and ensure that your applications are stable and responsive.
Scaling Applications Dynamically
As demand for your applications fluctuates, you need to scale them up or down accordingly. k9s simplifies this process by allowing you to scale deployments directly from the interface. With a few keystrokes, you can adjust the number of replicas for your deployments, handling increased load or saving on resources during quieter times.
Leveraging RBAC for Secure Access
Role-Based Access Control (RBAC) is crucial for maintaining security in your Kubernetes clusters. k9s respects the RBAC rules defined in your cluster, ensuring that users can only perform actions they’re authorized to.
Understanding and Applying RBAC Rules
With k9s, you can review and manage RBAC rules with ease. This means you can ensure that your team members have the right level of access to perform their jobs, without compromising the security of your cluster.
Reverse Lookup to Assess Permissions
Ever wonder which resources a particular user or service account can access? k9s offers a reverse lookup feature that lets you assess permissions quickly. This is invaluable for auditing and compliance, as well as for troubleshooting access issues.
Making the Most of K9s Documentation
Even with an intuitive interface, there will be times when you need a little extra help. That’s where the k9s documentation comes in. It’s a treasure trove of information, covering everything from installation to advanced features.
Navigating s Documentation for Troubleshooting
When you run into an issue, the k9s documentation should be your first stop. It’s well-organized and searchable, making it easy to find the information you need to troubleshoot your problems.
Example: If you’re having trouble connecting k9s to your cluster, the documentation has a section on troubleshooting connectivity issues, complete with common problems and their solutions.
Armed with this knowledge, you’re well on your way to becoming a k9s power user. In the final part of this article, we’ll cover deploying an example application, monitoring and managing deployments, and share some final reflections on streamlining Kubernetes operations.
Your First k9s Command: A Step-by-Step Guide
Let’s roll up our sleeves and dive into your first k9s command. It’s important to start with something practical to get a feel for how k9s works. We’ll begin by deploying a simple application to your Kubernetes cluster.
First, ensure your Kubernetes cluster is up and running. If you’re testing locally, a Minikube cluster will do just fine. Once you have your cluster ready, open up your terminal and launch k9s.
Deploying an Example Application
Deploying an application with k9s is as straightforward as it gets. You’ll use the same YAML files you’re familiar with from kubectl. In the k9s terminal UI, you simply press Ctrl-a to bring up the command prompt, then type apply -f /path/to/your/yaml. Hit enter, and k9s will take care of the rest, deploying your application to the cluster.
Let’s say you have a YAML file for a simple nginx deployment. With k9s, you can apply this file without leaving the UI. It’s all about keeping things efficient and straightforward.
Monitoring and Managing Deployments
After deploying your application, you’ll want to keep an eye on it. k9s shines in this area, offering a live view of your deployments. You can see the number of replicas, their status, and any recent events. To monitor your deployment, just type :deploy and navigate to your application.
If you need to scale up or down, no problem. Select your deployment and press s. Enter the number of replicas you want, and k9s will update your deployment on the fly. It’s that easy. For more on managing replicas, see our Kubernetes Replica Set guide.
Final Reflections: Streamlining Kubernetes Operations
Throughout this guide, we’ve explored the power and flexibility of k9s CLI. We’ve seen how it can transform the Kubernetes management experience, making it more intuitive, efficient, and downright enjoyable.
k9s offers a terminal-based UI that simplifies cluster management with real-time updates and easy navigation.
It supports extensive customization, allowing you to tailor the tool to your workflow with command shortcuts, key binds, and plugins.
Monitoring your cluster’s health and managing resources effectively becomes second nature with k9s.
With RBAC integration, k9s ensures secure access to your cluster’s resources.
Regular updates and a comprehensive documentation keep you on top of your game.
By embracing k9s, you’re not just adopting a tool; you’re adopting a more streamlined way of working with Kubernetes. It’s about spending less time typing commands and more time delivering value.
Frequently Asked Questions
Let’s address some common questions to round off your understanding of k9s CLI.
How Does k9s CLI Simplify Kubernetes Management?
k9s provides a visual interface that makes it easier to interact with your Kubernetes cluster. Instead of remembering and typing out complex kubectl commands, you can navigate and manage your cluster with intuitive keyboard shortcuts and commands.
Real-time monitoring of cluster metrics and resources.
Live logs and event streaming for proactive troubleshooting.
Quick resource management, including edits, scaling, and deletion.
Customizable interface with plugins and shortcuts to fit your workflow.
k9s turns the chore of cluster management into a more manageable, even enjoyable, task.
Can k9s Interface with Any Kubernetes Cluster?
Absolutely. k9s works with any Kubernetes cluster as long as you have the correct kubeconfig file set up. It seamlessly integrates with your current Kubernetes configuration, making it a versatile tool for all your cluster management needs.
Is There a GUI Version of k9s?
k9s is strictly a terminal-based UI, designed to bring efficiency and effectiveness to those who are comfortable working within a terminal environment. There’s no graphical user interface (GUI) version of k9s, as the terminal UI is one of its key strengths.
For those who prefer a GUI, other tools like Kubernetes Dashboard or Lens might be more suitable. However, for terminal enthusiasts, k9s offers a powerful and fast alternative.
How Do I Create Custom Resource Definitions with k9s?
Creating Custom Resource Definitions (CRDs) with k9s is similar to how you would with kubectl. You define your CRDs in a YAML file and use k9s to apply them to your cluster. The command is apply -f your-crd.yaml, and you can execute this within the k9s command prompt.
What Are the System Requirements for Installing k9s?
k9s is a lightweight tool that doesn’t require much in terms of system resources. You’ll need:
Managing Kubernetes clusters can be complex, but with the right tools, it becomes significantly easier. One such tool is Kubernetes Lens, which acts as an IDE for Kubernetes, allowing you to manage your clusters, applications, and services with ease. Whether you’re looking to troubleshoot pods, navigate through your clusters, or simply manage your workloads, Kubernetes Lens offers a user-friendly interface that simplifies the process.

