
Article-at-a-Glance: Master Kubernetes Monitoring
Understand the importance of monitoring Kubernetes clusters and the role of Prometheus Node Exporter.
Step-by-step guide to setting up Prometheus Node Exporter on your Kubernetes cluster.
Learn how to verify the installation and ensure the Node Exporter is properly collecting metrics.
Discover the key metrics that Prometheus Exporter provides for monitoring system health.
Gain insights on integrating Prometheus with visualization tools like Grafana cloud for better monitoring.
Enter the World of Kubernetes Monitoring
Monitoring is not just about keeping an eye on your Kubernetes clusters; it’s about being proactive, about catching issues before they turn into outages. And when it comes to monitoring, Prometheus Node Exporter is a game-changer. It’s like having a health checkup for your cluster’s nodes, ensuring they’re in top shape and performing as expected.
Think of your Kubernetes cluster as a busy beehive. Each bee has a job to do, and if one starts to slack, it can affect the whole hive. That’s where monitoring comes in. By keeping tabs on each bee, or in our case, each node, you ensure the hive thrives.
Why Monitor Your Kubernetes Clusters?
Monitoring your Kubernetes clusters is critical. It’s how you ensure that the applications running on your cluster are available and performing optimally. Without monitoring, you’re flying blind, and running the risk of not just catastrophic failures, but also of being unaware of them. For any modern software application, that’s a risk you can’t afford to take.
“Monitoring is about gaining visibility into your cluster’s operations and health. It’s not just about fixing problems, it’s about preventing them.”
By monitoring, you can track resource usage, system performancecatch performance bottlenecks, and get alerted to potential issues before they cause trouble. It’s the difference between a smooth sail and a shipwreck.
History of Prometheus
Overview: Prometheus is an open-source systems monitoring and alerting toolkit originally built at SoundCloud. Since its inception, it has become a leading monitoring solution, particularly for cloud-native and containerized environments like Kubernetes. It collects and stores metrics as time series data, providing powerful querying capabilities and a flexible alerting mechanism.
History:
2012: Development of the Prometheus project started by former Google engineers at SoundCloud.
2015: Prometheus was released as open source.
2016: Prometheus joined the Cloud Native Computing Foundation (CNCF) as the second hosted project after Kubernetes, marking its significance in the cloud-native ecosystem.
Key Features:
Multi-dimensional Data Model: Metrics are identified by a metric name and key-value pairs.
Flexible Query Language (PromQL): Allows for powerful and flexible querying of time series data.
Autonomous Server: Prometheus can operate independently, without reliance on distributed storage.
Time Series Database: Efficient storage of time series data.
Pull-based Metrics Collection: Prometheus scrapes metrics from instrumented jobs.
Service Discovery: Integrates with various service discovery mechanisms (e.g., Kubernetes, Consul).
Architecture:
Prometheus Server: Core component that scrapes and stores time series data.
Client Libraries: Used to instrument applications to expose metrics.
Pushgateway: Allows ephemeral and batch jobs to push metrics.
Alertmanager: Handles alerts generated by Prometheus, managing deduplication, grouping, and routing.
Exporters: Provide metrics from third-party systems.
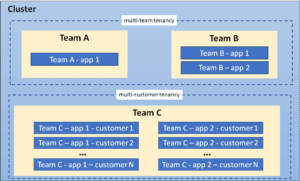
Prometheus in Kubernetes
Prometheus is widely used to monitor Kubernetes clusters due to its robust integration with the Kubernetes ecosystem. Here’s how it is used:
Service Discovery: Prometheus can dynamically discover Kubernetes pods, nodes, services, and other resources via the Kubernetes API. This is crucial for monitoring dynamic and ephemeral environments typical of Kubernetes clusters.
Scraping Metrics: Prometheus scrapes metrics from Kubernetes components such as the kubelet, API server, controller manager, and etcd. It can also scrape custom metrics from applications running in the cluster.
Exporters: Various exporters are available for Kubernetes, such as the Node Exporter for node-level metrics and kube-state-metrics for detailed cluster state metrics.
Prometheus Operator: The Prometheus Operator simplifies the deployment and management of Prometheus instances within Kubernetes. It provides Kubernetes native deployment and management of Prometheus, Alertmanager, and related configurations.
Visualization and Alerting: Metrics collected by Prometheus can be visualized using tools like Grafana. Prometheus’ Alertmanager can be used to create and manage alerting rules, sending notifications to various channels such as Slack, email, or PagerDuty.
The Role of Prometheus Node Exporter
Prometheus Node Exporter is your lookout on the mast. It is an open-source monitoring solution that gives you a detailed view of your Kubernetes nodes, exposing a wealth of metrics like CPU usage, memory pressure, disk space, and more. With Node Exporter, you can see if a node is under too much load or if it’s sailing smoothly.
But it’s not just about watching numbers go up and down. Prometheus Node Exporter helps you understand the story behind the data. Why is the CPU usage high? Is it normal, or is there a problem? Node Exporter helps you ask the right questions and find the answers.
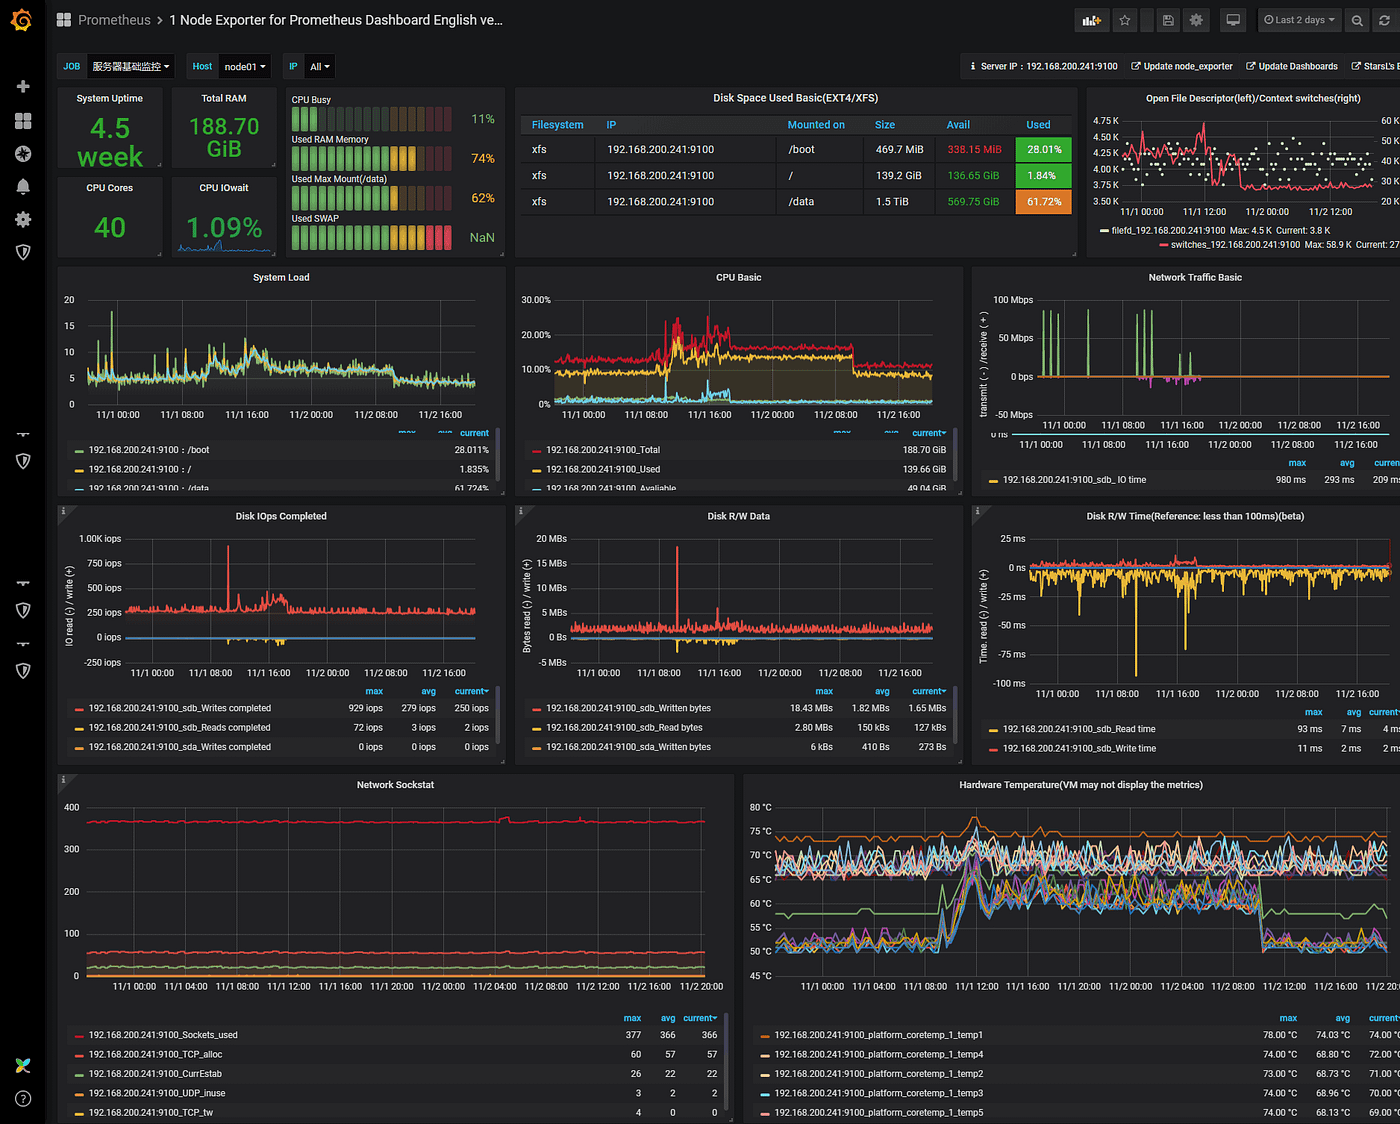
“Create a Prometheus Monitoring Server …” from levelup.gitconnected.com and used with no modifications.
Setting Up Your Monitoring Station
Prerequisites for Node Exporter Setup
Before we dive into the setup, let’s ensure we have everything we need:
A running Kubernetes cluster.
kubectl access configured for your cluster.
Basic understanding of Kubernetes components and Prometheus.
Got everything? Great! Let’s set up our monitoring station with Prometheus Node Exporter.
Installing Prometheus Node Exporter
Installing Node Exporter on Kubernetes is like setting up a new lookout post. You want it to have a clear view of everything that’s going on. Here’s how you do it:
The first thing is to create a dedicated namespace for your monitoring tools. This keeps things organized and easy to manage.
Use a Helm chart to deploy Prometheus Node Exporter. Helm is like the Swiss Army knife for Kubernetes; it makes complex deployments a breeze.
Once deployed, Node Exporter will run as a DaemonSet, ensuring that there’s a Node Exporter pod on each node of your cluster.
And just like that, you’ve got eyes on all your nodes.
Example Command:
kubectl create namespace monitoring
Example Command:helm install prometheus-node-exporter stable/prometheus-node-exporter --namespace monitoring
These commands set the stage for a robust monitoring setup with Prometheus Node Exporter on Kubernetes. They’re the first steps in turning data into actionable insights.
Verifying the Node Exporter Installation
After deploying Node Exporter, you’ll want to make sure it’s working correctly. Think of it as a test run for your lookout post. You need to know it’s alert and reporting back accurately.
Check the DaemonSet and ensure that a Node Exporter pod is running on each Kubernetes node.
Use the
kubectl get podscommand to list the pods in the monitoring namespace and check their status.Confirm that the Node Exporter is exposing metrics by accessing the metrics endpoint on any of the Node Exporter pods.
Seeing everything green? That’s what we’re aiming for. A successful installation means you’re ready to start monitoring.
Remember, setting up monitoring is not a one-time job. It’s an ongoing process of tuning and adjusting to ensure your clusters are performing at their best. But with Prometheus Node Exporter on your side, you’re well-equipped to keep your Kubernetes clusters in shipshape.
Configuring Prometheus to Scrape Node Metrics
Now that Node Exporter is up and running, it’s time to configure Prometheus to start scraping those metrics. Prometheus uses a pull-based approach, which means it will regularly fetch data from Node Exporter at intervals you specify. Think of it as Prometheus knocking on the door of each Node Exporter, asking for the latest news.
To set this up, you’ll need to edit the Prometheus config file, usually called prometheus.yml. Here, you’ll add the Node Exporter as a scrape target. You’ll define the job name, the scrape interval, and the Kubernetes nodes you want to monitor. After saving your changes, reload Prometheus to start collecting those system level metrics.
Accessing Metrics Through Prometheus Web UI
With Prometheus now collecting metrics, you’ll want to see them for yourself. Accessing these metrics is as easy as opening your web browser and navigating to the Prometheus dashboard. Here, you’ll find the main expression bar, where you can query the data Prometheus has gathered. It’s like having a conversation with your cluster, asking how it’s doing and what’s new.
Try querying for node_cpu_seconds_total to see CPU usage or node_memory_MemAvailable_bytes for available memory. These metrics give you a live snapshot of your cluster’s health, and the Prometheus dashboard makes it all accessible in just a few clicks.
Leveraging Metrics for Cluster Health
Metrics are more than just numbers; they tell a story about your cluster’s health and performance. By collecting and analyzing these metrics, you can ensure your cluster is running optimally and catch potential issues before they escalate.
Identifying Key Metrics for System Health
There are a handful of metrics that are particularly telling when it comes to the health of your Kubernetes cluster. Here are a few to keep an eye on:
CPU Usage: High CPU usage could indicate that your applications need more resources or that there’s an underlying issue causing excessive load.
Memory Usage: Monitoring memory usage helps you avoid the dreaded OutOfMemory errors that can bring down applications.
Disk Space: Running out of disk space can lead to all sorts of problems, from failing applications to an unstable cluster.
These metrics are like the vital signs for your cluster, and keeping them in check is crucial for a healthy system.
Setting Up Alerts for Anomalies
What happens when something goes wrong? You need to know—fast. That’s where alerts come in. Prometheus can be configured to send you notifications if certain conditions are met, like if CPU usage spikes unexpectedly or if disk space is running low.
Setting up alerts involves defining alert rules in Prometheus. These rules specify the conditions that trigger an alert and the severity level. Once an alert fires, it can be sent to you via email, Slack, or whichever communication tool you prefer. It’s like having a guard dog that barks only when it really matters.
Interpreting Metrics to Forecast Issues
Interpreting metrics is not just about reacting to current conditions; it’s about forecasting future issues. By analyzing trends over time, you can predict when you’ll need to scale up resources or when maintenance is due. It’s the best way to be proactive rather than reactive and to prevent problems before they happen.
For example, if you notice a gradual increase in memory usage over several days, you might deduce that you’ll need to add more memory soon. By anticipating this need, you can act before it becomes a problem, ensuring your applications continue to run smoothly.
Optimizing Performance with Node Exporter
With Node Exporter providing a wealth of metrics, it’s important to optimize its performance to ensure it doesn’t become a burden on your system.
Tuning Scrape Intervals for Efficient Monitoring
One key aspect is the scrape interval. This is how often Prometheus checks in with Node Exporter for the latest metrics. You want this interval to be frequent enough to catch issues quickly but not so frequent that it overwhelms your system. Finding that sweet spot is key to efficient monitoring.
For most clusters, a scrape interval of 15 to 30 seconds strikes a good balance. But this can vary depending on the size of your cluster and your specific needs.
Best Practices for Labeling and Filtering Metrics
Another aspect to consider is how you label and filter metrics. Labels are like tags that help you organize and query metrics more effectively. They can include information like the node name, the type of metric, and the environment (such as staging or production).
Filtering metrics allows you to focus on the data that’s most relevant to you. Instead of being overwhelmed by a flood of information, you can filter out the noise and concentrate on the metrics that matter.
When it comes to labels and filters, here are a few tips:
Be consistent with your labeling. This makes it easier to write queries and set up alerts.
Use meaningful labels that clearly describe what the metric is about.
Filter out redundant or irrelevant metrics to reduce storage and processing requirements.
By following these best practices, you can ensure that your monitoring system is both powerful and efficient.
Maximizing Resource Utilization and Reducing Overhead
Finally, it’s important to maximize resource utilization and reduce overhead. This means ensuring that Node Exporter runs efficiently without consuming more resources than necessary.
You can achieve this by tuning Node Exporter’s own resource limits in Kubernetes, making sure it has enough memory and CPU to do its job, but not so much that it’s wasteful. It’s all about balance—allocating just the right amount of resources for optimal performance.
Integrating with Visualization Tools
Metrics are most useful when you can see them at a glance. That’s where visualization tools like Grafana come in. They turn raw data into charts and graphs that make it easy to see what’s going on in your cluster.
Connecting Prometheus with Grafana
Connecting Prometheus with Grafana is straightforward. You’ll add Prometheus as a data source in Grafana, then you can start building dashboards. These dashboards can be customized to show the metrics that are most important to you, in a way that makes sense for your team.
Whether you want to see overall cluster health or dive into the details of a specific node, Grafana gives you the flexibility to visualize your data your way.
Building Informative Dashboards
Building dashboards in Grafana is like painting a picture. You start with a blank canvas and add only the elements that tell your story. You can include graphs for CPU and memory usage, gauges for disk space, and even maps if you’re monitoring multiple clusters around the world.
Here are a few tips for building informative dashboards:
Start with a clear goal in mind. What questions do you want your dashboard to answer?
Group related metrics together. This helps users quickly find the information they need.
Use color and size to highlight important metrics. Make it easy for users to see what’s important at a glance.
With a well-designed dashboard, you can transform complex data into insights that drive action.
Monitoring your Kubernetes cluster with Prometheus Node Exporter is like having a high-powered telescope. It brings the distant stars of your nodes into clear view, revealing the intricate details of their operation. By following the steps outlined here, you can ensure your cluster is not only monitored but also optimized for performance, health, and future growth.
Ensuring a Robust Monitoring Setup
Monitoring with Prometheus Node Exporter isn’t just a set-it-and-forget-it affair. It requires regular maintenance to ensure it continues to provide accurate and timely data. A robust monitoring setup is like a well-oiled machine; it needs occasional tuning and oil changes to run smoothly.
Maintaining Your Prometheus Node Exporter
Keep your Node Exporter up to date. Just like any other piece of software, Node Exporter gets updates that improve performance and add new features. Regularly check for updates and apply them to ensure you’re always using the latest and greatest version.
Another maintenance task is monitoring the Node Exporter itself. Yes, it’s a bit meta, but even your monitoring tools need monitoring. Keep an eye on its resource usage and logs to ensure it’s not experiencing any issues that could affect its ability to collect and report metrics.
Scaling Monitoring with Your Kubernetes Clusters
As your Kubernetes clusters grow, your monitoring needs to scale with them. More nodes mean more data, and your monitoring setup needs to handle that increased load. Here’s how you can scale your monitoring effectively:
Ensure your Prometheus instance is provisioned with enough resources to handle the additional metric data.
Consider sharding your Prometheus servers or using a federated setup if you have a large number of nodes.
Regularly review and optimize your Prometheus scrape configs to avoid overloading the system with unnecessary data collection.
Scaling your monitoring isn’t just about handling more data; it’s about maintaining the responsiveness and reliability of your monitoring system as your cluster grows.
By following these steps, you can create a monitoring setup that not only grows with your cluster but also remains effective and efficient, providing the insights you need to keep your Kubernetes environment healthy.
Frequently Asked Questions
How Often Should Metrics Be Scraped?
Metrics should be scraped at an interval that balances timeliness and system load. Typically, a scrape interval of 15 to 30 seconds works well for most setups. This frequency provides up-to-date information without overwhelming your Prometheus server or the nodes it’s monitoring.
Can Prometheus Node Exporter Monitor Multiple Clusters?
Yes, Prometheus Node Exporter can monitor multiple clusters. You’ll need to set up a Prometheus instance for each cluster or configure a single Prometheus server to scrape metrics from multiple clusters, possibly using federation for scalability.
What Is the Impact of Node Exporter on Cluster Performance?
Node Exporter is designed to be lightweight and should have minimal impact on cluster performance. However, it’s important to configure it properly to avoid any potential issues, such as setting appropriate resource limits and scrape intervals.
Is Node Exporter Suitable for Large-scale Kubernetes Deployments?
Absolutely. Node Exporter is suitable for large-scale deployments. For very large clusters, consider using Prometheus federation or sharding to distribute the load and ensure scalability.
How Do I Secure Access to Prometheus Metrics?
Securing access to Prometheus metrics involves several steps, such as storing sensitive data using Kubernetes Secrets.
Use authentication and TLS encryption for Prometheus endpoints.
Restrict access to the Prometheus UI and Grafana dashboards with proper authentication and authorization mechanisms.
Regularly review access controls and update them as necessary to ensure only authorized personnel can view and modify your monitoring setup.
Security is crucial, especially when dealing with sensitive data and system metrics. By securing access, you ensure that your monitoring data remains confidential and tamper-proof.
In conclusion, monitoring your Kubernetes clusters with Prometheus Node Exporter provides a powerful way to maintain visibility into your system’s health and performance. By setting up Node Exporter properly, maintaining and scaling your monitoring setup, and integrating with tools like Grafana, you’ll have a comprehensive view of your Kubernetes environment. With the insights gained from Prometheus Node Exporter, you’ll be well-equipped to make informed decisions, keep your clusters running smoothly, and proactively address any issues that arise.