Key Takeaways
Common symptoms of Ingress issues include unreachable services, 404 errors, SSL/TLS handshake errors, and slow response times.
Root causes often stem from incorrect Ingress resource configurations, backend service misconfigurations, Ingress controller deployment issues, and network policy conflicts.
Verify Ingress configurations by checking service names, ports, and inspecting rules and paths.
Analyze Ingress controller logs for common errors and assess network routes for DNS and routing issues.
Implement monitoring and alerts, regular configuration audits, and maintain clear documentation to manage Ingress effectively.
Troubleshooting Kubernetes Ingress Issues: A Comprehensive Guide
Kubernetes Ingress is a powerful resource that manages external access to services within a cluster, typically via HTTP and HTTPS. However, troubleshooting Ingress issues can be challenging. This guide will help you systematically diagnose and resolve common problems to ensure smooth operation.
Identifying Common Symptoms of Ingress Issues
First, you need to identify the symptoms that indicate Ingress issues. Recognizing these early can save you a lot of time and effort.
Service Unreachable
If your service is unreachable, it means that the traffic is not being correctly routed from the Ingress to the backend service. This can be due to several reasons, such as misconfigured Ingress rules or network policies.
404 Not Found Errors
Receiving a 404 error when trying to access a service usually indicates that the Ingress rules are not correctly defined, or the backend service is not available. Here are some common checks:
Ensure that the service name and port specified in the Ingress match the actual service.
Verify that the paths defined in the Ingress rules are correct.
Check if the backend service is running and accessible.
SSL/TLS Handshake Errors
SSL/TLS handshake errors occur when there is a problem with the SSL/TLS configuration. Common reasons include:
Invalid or expired SSL/TLS certificates.
Incorrectly configured certificate and key pairs.
Mismatched SSL/TLS protocols between client and server.
Slow Response Times
Slow response times can be a symptom of several underlying issues, such as resource limitations, network latency, or inefficient backend services. Monitoring and analyzing the traffic flow can help pinpoint the cause.
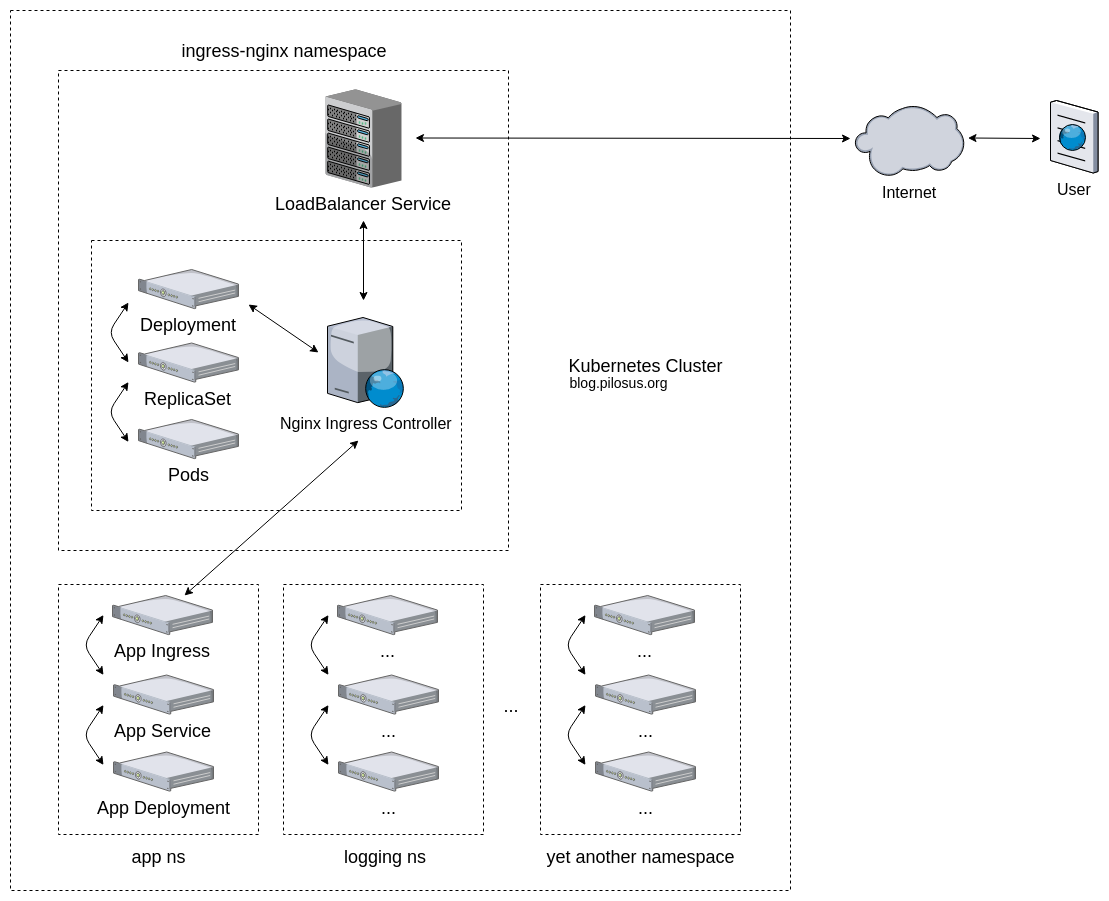
“Kubernetes Ingress Troubleshooting …” from blog.pilosus.org and used with no modifications.
Pinpointing Root Causes of Ingress Failures
“Most K8s resource creation failures are easy to debug, usually you can figure them out with either kubectl get or kubectl describe command on the failed resource.”
Understanding the root causes of Ingress failures is crucial for effective troubleshooting. Let’s explore some common causes.
Incorrect Ingress Resource Configuration
Misconfigured Ingress resources are a frequent cause of issues. This includes incorrect hostnames, paths, and backend service definitions. Always double-check your Ingress resource configuration.
Backend Service Misconfigurations
Backend services might be misconfigured, leading to traffic not being correctly routed. This can include incorrect service ports, missing selectors, or the service itself being down. For more insights on this, check out our guide on solving common Kubernetes issues.
Ingress Controller Deployment Issues
Problems with the Ingress controller deployment can also cause issues. Ensure that the Ingress controller is correctly deployed, running, and has the necessary permissions to manage Ingress resources.
Network Policy Conflicts
Network policies might block traffic between the Ingress controller and backend services. Verify that the network policies allow the necessary traffic flow.
Step-by-Step Troubleshooting Process
Now that we have identified common symptoms and root causes, let’s go through a step-by-step troubleshooting process.
Verify Ingress Configuration
Start by verifying the Ingress configuration. Ensure that the Ingress resource is correctly defined and matches the desired routing rules.
Checking Service Name and Port
Make sure that the service name and port specified in the Ingress resource match the actual service. Any discrepancies here can lead to traffic not being correctly routed.
Inspecting Rules and Paths
Inspect the rules and paths defined in the Ingress resource. Ensure that they correctly map to the backend services and paths you intend to expose.
Check Backend Services
Next, verify the backend services. Ensure that they are running and correctly configured to handle the traffic routed by the Ingress.
Ensure Pods are Running
Check that all Pods backing your services are in a Running state. Use the command:
kubectl get pods -o wide
If any Pods are not running, inspect their logs and events to determine why. A common issue might be resource constraints or misconfigurations in the Pod specification.
Service Configuration Accuracy
Verify that the Service configuration is correct. The service should expose the correct ports and have selectors that match the labels of the Pods. Use the following command to describe the service:
kubectl describe service <service-name>
Ensure that the service endpoints are correctly listed and match the expected Pods.
Analyze Ingress Controller Logs
Ingress controller logs are invaluable for diagnosing issues. Access these logs using kubectl to identify any errors or warnings that might indicate what’s wrong.
Accessing Logs Using kubectl
To access the Ingress controller logs, use the following command:
kubectl logs <ingress-controller-pod-name>
If your Ingress controller is deployed as a DaemonSet or Deployment, you may need to specify the Pod name and namespace. Check for any error messages or warnings that can provide clues about the issue.
Identifying Common Log Errors
Common log errors include:
404 Not Found – Indicates that the requested resource could not be found. Check the Ingress rules and backend services.
503 Service Unavailable – Indicates that the backend service is not available. Ensure that the service and Pods are running.
SSL Handshake Failed – Indicates an issue with SSL/TLS configuration. Verify the certificates and key pairs.
Assess and Verify Network Routes
Network routes can sometimes be the root cause of Ingress issues. Ensure that traffic is correctly routed from the external load balancer to the Ingress controller and then to the backend services. For more insights, you can read about diagnosing network policy issues in a Kubernetes cluster.
DNS Resolution Checks
Verify that DNS resolution is working correctly. Ensure that the domain names specified in the Ingress rules resolve to the correct IP addresses. Use tools like nslookup or dig to check DNS resolution. For more detailed troubleshooting, consider reading about network policy issues in Kubernetes clusters.
Routing and Load Balancer Configuration
Ensure that the load balancer is correctly configured to route traffic to the Ingress controller. Check the load balancer settings and ensure that the health checks are correctly configured.
Advanced Troubleshooting Techniques
For more complex issues, advanced troubleshooting techniques may be necessary. These techniques can help you diagnose and resolve issues that are not immediately apparent.
Load Balancer Specific Issues
Different cloud providers have different load balancer configurations and troubleshooting steps. Here are some specific tips for AWS and GCP load balancers.
Troubleshooting AWS ALB
If you are using AWS ALB, ensure that the target group health checks are correctly configured. Use the AWS Management Console or CLI to check the status of the target groups and ensure that the Ingress controller is healthy.
Checking GCP Load Balancer Settings
For GCP load balancers, ensure that the backend services and health checks are correctly configured. Use the GCP Console or gcloud CLI to verify the load balancer settings and ensure that the Ingress controller is healthy.
Security Policies and Firewalls
Security policies and firewalls can sometimes block traffic to and from the Ingress controller. Ensure that the necessary firewall rules and network policies are in place to allow traffic flow.
Ingress Network Policies
Verify that the network policies allow traffic from the Ingress controller to the backend services. Use the following command to describe the network policies:
kubectl describe networkpolicy <policy-name>
Firewall Rules Alignment
Ensure that the firewall rules align with the network policies and allow traffic to and from the Ingress controller. Verify the firewall settings in your cloud provider’s console. For more detailed steps, you can check out this guide on diagnosing network policy issues in a Kubernetes cluster.
Troubleshooting SSL/TLS Issues
SSL/TLS issues are common when dealing with Ingress. Ensure that the certificates and key pairs are correctly configured and valid.
Certificate Validation
Verify that the SSL/TLS certificates are valid and not expired. Use the following command to check the certificate details:
openssl x509 -in <certificate-file> -text -noout
Ensuring Proper Key and Certificate Pairs
Ensure that the SSL/TLS key and certificate pairs are correctly configured. Use the following command to verify the key and certificate pair:
openssl x509 -noout -modulus -in <certificate-file> | openssl md5openssl rsa -noout -modulus -in <key-file> | openssl md5
Ensure that the output of both commands matches.
Resource Limits and Quotas
Resource limits and quotas can sometimes cause Ingress issues. Ensure that the Ingress controller has enough resources to handle the traffic.
Reviewing Resource Usage
To check the resource usage of your Ingress controller and backend services, you can use the kubectl top command. This command provides a snapshot of the current resource usage:
kubectl top pod <pod-name>
Ensure that the CPU and memory usage are within the allocated limits. If the usage is consistently high, consider increasing the resource limits.
Adjusting Resource Quotas
If you find that your Ingress controller or backend services are constrained by resource limits, you can adjust the quotas. Update the resource requests and limits in your deployment or stateful set configurations. For example, you can follow this guide on automating solutions for pod eviction issues to ensure optimal resource allocation.
  apiVersion: apps/v1  kind: Deployment
  metadata:
    name: my-ingress-controller
  spec:
    containers:
    - name: ingress-controller
      image: nginx-ingress-controller:latest
      resources:
        requests:
          memory: "256Mi"
          cpu: "500m"
        limits:
          memory: "512Mi"
          cpu: "1"
Make sure to apply the updated configuration using the kubectl apply command.
Empowering Continuous Ingress Management
Effective Ingress management requires continuous monitoring, regular audits, and clear documentation. Implementing these practices can help you proactively identify and resolve issues.
Implementing Monitoring and Alerts
Monitoring and alerts can help you quickly identify and resolve Ingress issues. Use tools like Prometheus and Grafana to monitor the Ingress controller and backend services.
Using Prometheus and Grafana
Prometheus collects metrics from the Ingress controller and backend services, while Grafana provides a dashboard to visualize these metrics. To set up Prometheus and Grafana, follow these steps for Kubernetes monitoring:
Deploy Prometheus and Grafana using Helm charts or Kubernetes manifests.
Configure Prometheus to scrape metrics from the Ingress controller and backend services.
Create Grafana dashboards to visualize the metrics and set up alerts for any anomalies.
Setting Up Alerts for Ingress Failures
Set up alerts for common Ingress failures, such as 404 errors, 503 errors, and SSL/TLS handshake failures. Use tools like Alertmanager to send notifications when an alert is triggered. For example, you can set up an alert for 503 errors with the following Prometheus rule:
  alert: Ingress503Errors
  expr: sum(rate(nginx_ingress_controller_requests{status="503"}[5m])) > 0
  for: 5m
  labels:
    severity: critical
  annotations:
    summary: "503 errors detected"
    description: "More than 0 503 errors in the last 5 minutes"
Regular Configuration Audits
Regular configuration audits can help you identify and resolve misconfigurations before they cause issues. Automate the audits using CI/CD pipelines to ensure consistency. For more on automating CI/CD pipelines check out our cloud agnostic guide to CI/CD automation.
Automating Audits with CI/CD
Use CI/CD pipelines to automate configuration audits. Ensure that the Ingress configuration is validated and tested before deployment.
Best Practices for Configuration Management
Follow best practices for configuration management to ensure that the Ingress configuration is consistent and reliable. Use version control to track changes and maintain a history of configurations.
Documentation and Knowledge Sharing
Clear documentation and knowledge sharing can help your team effectively manage Ingress. Maintain comprehensive documentation and share knowledge within your team.
Tracking Ingress Changes
Track changes to the Ingress configuration using version control. Ensure that all changes are documented and reviewed before deployment.
Maintaining Clear Documentation
Maintain clear and comprehensive documentation for the Ingress configuration. Include details about the Ingress rules, backend services, and any custom configurations.
Frequently Asked Questions (FAQ)
How do I find out if my Ingress is misconfigured?
Check the Ingress resource configuration using the kubectl describe ingress command. Verify that the hostnames, paths, and backend services are correctly defined. If there are any discrepancies, update the Ingress resource accordingly.
What logs should I review for Ingress issues?
Review the Ingress controller logs using the kubectl logs command. Look for common errors such as 404 Not Found, 503 Service Unavailable, and SSL Handshake Failed. These logs can provide valuable insights into what might be causing the issues. For more detailed information on troubleshooting, you can refer to this guide on Kubernetes monitoring and troubleshooting.
What’s the easiest way to verify SSL/TLS issues with Ingress?
Use the openssl command to check the SSL/TLS certificates and key pairs. Ensure that the certificates are valid and the key and certificate pairs match. For example, you can use the following commands to verify the key and certificate pair:
openssl x509 -noout -modulus -in <certificate-file> | openssl md5openssl rsa -noout -modulus -in <key-file> | openssl md5
Ensure that the output of both commands matches.
Can network policies affect my Ingress performance?
Yes, network policies can block traffic to and from the Ingress controller. Verify that the network policies allow the necessary traffic flow. Use the following command to describe the network policies:
kubectl describe networkpolicy <policy-name>
Ensure that the policies are correctly configured to allow traffic between the Ingress controller and backend services.