Key Takeaways
-
Understanding the role of nodes in AKS is crucial for efficient debugging.
-
Common issues in AKS include resource constraints, network connectivity problems, and misconfigurations.
-
Using tools like kubectl and Azure Monitor can simplify the debugging process.
-
Regular maintenance and upgrades can prevent many common issues.
-
Proactive monitoring and documentation are key to maintaining a healthy AKS environment.
Debug Like a Pro: Solving Common Kubernetes Issues in Azure AKS
Why Debugging Matters
Debugging is an essential skill for anyone working with Kubernetes, especially when using Azure Kubernetes Service (AKS). It helps ensure that your applications run smoothly and efficiently. Most importantly, effective debugging can save you time and resources by quickly identifying and resolving issues before they escalate.
Common AKS Issues at a Glance
Before diving into specific techniques, it's helpful to know what types of issues you might encounter in AKS. Common problems include:
-
Resource constraints, such as limited CPU or memory.
-
Network connectivity issues between nodes and pods.
-
Misconfigurations in node settings or Kubernetes manifests.
-
Software bugs or outdated software versions.
"Several factors can lead to AKS node issues, including networking problems, resource constraints, misconfigurations, and software bugs."
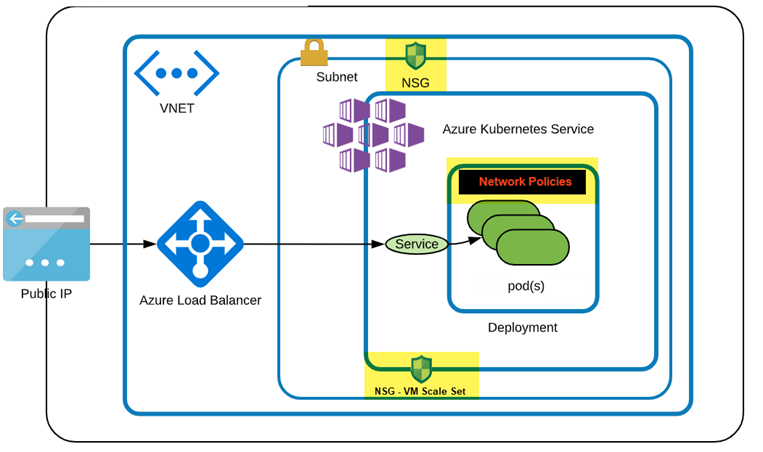
"Mastering AKS Troubleshooting #1 ..." from argonsys.com and used with no modifications.
Foundational Knowledge: AKS Nodes
Understanding the role and configuration of nodes in AKS is the first step toward effective debugging. Nodes are the backbone of your Kubernetes cluster, responsible for running your containerized applications.
-
Nodes can be either virtual machines (VMs) or physical servers.
-
Each node contains the services necessary to run pods and is managed by the master components of the cluster.
-
Nodes can be scaled up or down to meet the demands of your applications.
Role of Nodes in AKS
Nodes in AKS are essentially the workhorses of your Kubernetes cluster. They run the actual application workloads in the form of pods. Each node has the services required to manage these pods, including the container runtime, kubelet, and kube-proxy.
The kubelet ensures that containers are running in a pod, while kube-proxy maintains network rules on nodes. These components work together to ensure that your applications run smoothly and can communicate with each other.
Node Setup and Configuration
Setting up nodes correctly is crucial for the performance and reliability of your AKS cluster. Misconfigurations can lead to a host of issues, from resource bottlenecks to network failures.
When configuring nodes, consider the following:
-
Ensure that the node size matches the resource requirements of your applications.
-
Configure network settings to allow seamless communication between nodes and pods.
-
Regularly update the software on your nodes to include the latest security patches and features.
Utilizing AKS Diagnostic Tools
Azure provides a range of diagnostic tools specifically designed to help you troubleshoot issues in AKS. These tools can help you quickly identify and resolve problems, ensuring that your applications remain available and performant.
Accessing the AKS Diagnostics Tool
To access the AKS diagnostics tool:
-
In the Azure portal, search for and select Kubernetes services.
-
Select the name of your AKS cluster.
-
In the navigation pane of the AKS cluster page, select Diagnose and solve problems.
Interpreting Diagnostic Results
Once you've accessed the diagnostics tool, you'll be presented with a range of information about the health and performance of your cluster. This includes metrics on resource usage, network connectivity, and error logs.
Use this information to identify any anomalies or issues that could be affecting your cluster. For example, if you notice that a particular node is consistently running out of memory, you may need to allocate more resources or optimize your application to use memory more efficiently.
Network Troubleshooting with kubectl exec
Network issues can be one of the trickiest problems to diagnose in a Kubernetes cluster. These issues can disrupt communication between nodes and pods, leading to application failures. Fortunately, the kubectl exec command allows you to run commands directly inside your containers, making it a powerful tool for network troubleshooting.
To use kubectl exec for network troubleshooting:
-
First, identify the pod you want to troubleshoot using kubectl get pods.
-
Next, run kubectl exec -it -- /bin/bash to open a shell inside the pod.
-
From within the pod, you can use network diagnostic tools like ping, curl, and netstat to test connectivity.
For example, if you suspect a network issue between two pods, you can ping one pod from another to check connectivity. If the ping fails, you know there is a network issue that needs to be addressed.
Analyzing Node Logs
Logs are invaluable for diagnosing issues in your AKS cluster. They provide detailed information about the state of your nodes and the applications running on them. To analyze node logs, you can use a variety of tools and commands.
-
Use kubectl logs to view logs from a specific pod.
-
For node-level logs, use the Azure portal or Azure Monitor to access detailed logs.
-
Look for error messages, stack traces, and other anomalies that could indicate a problem.
By carefully examining these logs, you can often pinpoint the root cause of an issue. For instance, if you see repeated errors about insufficient memory, you might need to adjust your resource allocations or scale your nodes.
Utilizing Azure Monitor
Azure Monitor is a comprehensive monitoring solution that provides insights into the performance and health of your AKS cluster. It offers real-time metrics, logs, and alerts, making it easier to identify and resolve issues.
To get started with Azure Monitor:
-
Navigate to the Azure portal and select your AKS cluster.
-
In the left-hand menu, select Monitoring and then Insights.
-
Here, you can view metrics like CPU and memory usage, network traffic, and more.
By setting up alerts in Azure Monitor, you can proactively address issues before they impact your applications. For example, you can create an alert to notify you if CPU usage exceeds a certain threshold, allowing you to take action before performance degrades.
"By following the guidelines outlined in this guide, you can streamline the debugging process and ensure the reliability and performance of your Kubernetes workloads."
Best Practices for Debugging
-
Automate monitoring and alerting to catch issues early.
-
Optimize node configurations to ensure efficient resource use.
-
Maintain thorough documentation and encourage team collaboration.
Implementing best practices can significantly improve your debugging efforts. Automated monitoring and alerting can help you catch issues early, while optimizing node configurations ensures efficient use of resources.
Automated Monitoring and Alerting
Automated monitoring and alerting are crucial for maintaining the health of your AKS cluster. By setting up automated alerts, you can quickly respond to issues before they escalate.
To set up automated alerts:
-
Use Azure Monitor to create custom alerts based on specific metrics.
-
Set thresholds for key metrics like CPU usage, memory usage, and network traffic.
-
Configure notifications to alert you via email or SMS when an alert is triggered.
For example, you can create an alert to notify you if a node's CPU usage exceeds 80% for more than five minutes. This allows you to investigate and resolve the issue before it impacts your applications.
Optimizing Node Configurations
Proper node configuration is essential for the performance and reliability of your AKS cluster. Misconfigurations can lead to resource bottlenecks, network issues, and other problems.
To optimize node configurations:
-
Ensure that nodes are sized appropriately for your workloads.
-
Configure network settings to allow seamless communication between nodes and pods.
-
Regularly update node software to include the latest security patches and features.
For example, if you notice that a node is consistently running out of memory, you might need to increase the node size or optimize your application to use memory more efficiently. Learn more about optimizing resource utilization for your workloads.
Maintaining Documentation and Collaboration
Maintaining thorough documentation and fostering collaboration among your team can significantly improve your debugging efforts. Documenting issues and their resolutions helps ensure that similar problems can be quickly addressed in the future.
Encourage team members to share their experiences and insights, and consider using collaboration tools like Slack or Microsoft Teams to facilitate communication.
Preventive Measures
Taking preventive measures can help you avoid many common issues in your AKS cluster. Regular maintenance, resource utilization analysis, and effective node naming and labeling are all important practices.
Regular Node Maintenance and Upgrades
Regular maintenance and upgrades are crucial for keeping your AKS cluster secure and up-to-date. This includes applying security patches, updating software, and performing routine checks to ensure everything is running smoothly.
To perform regular maintenance:
-
Schedule maintenance windows to minimize disruption to your workloads.
-
Regularly check for and apply security patches and software updates.
-
Monitor the health of your nodes and address any issues promptly.
Resource Utilization Analysis
Analyzing resource utilization can help you identify and address potential bottlenecks in your AKS cluster. This involves monitoring metrics like CPU usage, memory usage, and network traffic to ensure that resources are being used efficiently. For an in-depth guide on this, check out Kubernetes monitoring with Prometheus.
Use tools like Azure Monitor to track resource utilization and identify any nodes that are consistently over- or under-utilized. Adjust resource allocations as needed to ensure optimal performance.
Effective Node Naming and Labeling
Effective node naming and labeling can make it easier to manage and troubleshoot your AKS cluster. Use meaningful names and labels to identify nodes and their roles within the cluster.
-
Use consistent naming conventions to make it easier to identify nodes.
-
Apply labels to nodes to indicate their roles and any special configurations.
-
Document naming and labeling conventions to ensure consistency across your team.
Real-Time Debugging Scenarios
Debugging in real-time can be a lifesaver when dealing with critical issues in your AKS cluster. Here are some common scenarios and how to handle them effectively.
Handling Resource Constraints
Resource constraints, such as limited CPU or memory, can severely impact the performance of your applications. To handle these constraints:
-
Monitor resource usage regularly using Azure Monitor.
-
Identify nodes or pods that are consuming excessive resources.
-
Scale your node pool or optimize your application to use resources more efficiently.
"If you notice that a node is consistently running out of memory, you might need to increase the node size or optimize your application to use memory more efficiently."
Resolving Network Connectivity Issues
Network connectivity issues can disrupt communication between nodes and pods, leading to application failures. To resolve these issues:
-
Use kubectl exec to access pod terminals and perform network diagnostics.
-
Check network security group (NSG) rules and Azure Virtual Network (VNet) configurations.
-
Ensure that your network settings allow seamless communication between nodes and pods.
"If you suspect a network issue between two pods, you can ping one pod from another to check connectivity. If the ping fails, you know there is a network issue that needs to be addressed."
Key Takeaways and Final Thoughts
Effective debugging is crucial for maintaining the health and performance of your AKS cluster. By following best practices and using the right tools, you can quickly identify and resolve issues before they impact your applications.
Proactive Debugging Strategies
Proactive debugging involves setting up automated monitoring and alerting, optimizing node configurations, and maintaining thorough documentation. These strategies can help you catch issues early and resolve them before they escalate. For an in-depth guide, check out this article on Kubernetes monitoring with Prometheus.
Ensuring Cluster Health and Performance
Regular maintenance, resource utilization analysis, and effective node naming and labeling are all important practices for ensuring the health and performance of your AKS cluster. By taking preventive measures, you can avoid many common issues and keep your applications running smoothly.
Continual Learning and Adaptation
Debugging is an ongoing process that requires continual learning and adaptation. Stay up-to-date with the latest best practices, tools, and techniques to ensure that you can effectively troubleshoot and resolve issues in your AKS cluster.
Frequently Asked Questions (FAQ)
How do I access diagnostic tools in Azure AKS?
To access diagnostic tools in Azure AKS:
-
In the Azure portal, search for and select Kubernetes services.
-
Select the name of your AKS cluster.
-
In the navigation pane of the AKS cluster page, select Diagnose and solve problems.
What are the common signs of node issues in AKS?
Common signs of node issues in AKS include:
-
High CPU or memory usage.
-
Network connectivity problems.
-
Frequent pod evictions or restarts.
-
Error messages in node or pod logs.
By monitoring these signs and using the diagnostic tools and techniques outlined in this guide, you can quickly identify and resolve node issues in your AKS cluster.