Key Takeaways
-
Effective monitoring of Kubernetes clusters improves performance and reliability.
-
Prometheus and Grafana are powerful tools for monitoring and visualization.
-
Proper setup and configuration of Prometheus and Grafana are essential for accurate data collection.
-
Custom dashboards in Grafana provide real-time insights into Kubernetes metrics.
-
Setting up alerts with Prometheus ensures proactive issue resolution.
Best Practices for Monitoring Kubernetes with Prometheus and Grafana
Importance of Effective Monitoring in Kubernetes
Effective monitoring in Kubernetes is crucial for maintaining the health and performance of your applications. Without proper monitoring, identifying and resolving issues becomes challenging, which can lead to downtime and degraded user experience. Therefore, leveraging tools like Prometheus and Grafana can provide the visibility needed to keep your systems running smoothly.
Introduction to Prometheus and Grafana
Prometheus is an open-source monitoring and alerting toolkit designed specifically for reliability and scalability. It collects metrics from configured targets at specified intervals, evaluates rule expressions, displays the results, and can trigger alerts if certain conditions are met. On the other hand, Grafana is an open-source platform for monitoring and observability. It allows you to query, visualize, alert on, and understand your metrics no matter where they are stored.
Combining Prometheus and Grafana provides a robust monitoring solution for Kubernetes clusters. Prometheus handles the data collection and alerting, while Grafana offers powerful visualization capabilities to make sense of the collected data.
"Prometheus and Grafana together form a powerful monitoring stack that can provide deep insights into your Kubernetes environment."
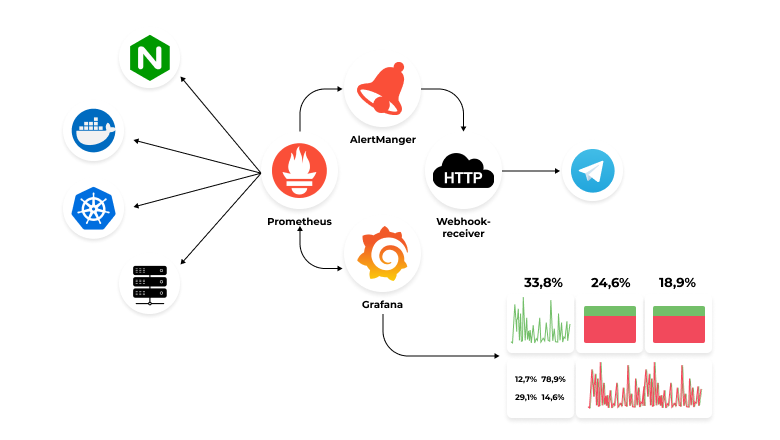
"Monitoring System with Prometheus ..." from doubletapp.medium.com and used with no modifications.
Preparing Your Kubernetes Cluster for Monitoring
Setting Up Prometheus Operator
The first step in setting up monitoring for your Kubernetes cluster is to deploy the Prometheus Operator. The Prometheus Operator simplifies the deployment and management of Prometheus instances in Kubernetes. It automates tasks such as Prometheus setup, configuration, and management, making it easier to maintain a reliable monitoring setup. For more advanced monitoring solutions, consider exploring Datadog Kubernetes monitoring and troubleshooting techniques.
To install the Prometheus Operator, you can use Helm, a package manager for Kubernetes. Helm charts make it easy to deploy and manage Kubernetes applications.
-
First, add the Prometheus Helm repository:
helm repo add prometheus-community https://prometheus-community.github.io/helm-charts -
Update your Helm repositories:
helm repo update -
Install the Prometheus Operator:
helm install prometheus-operator prometheus-community/kube-prometheus-stack
Configuring RBAC Permissions
Role-Based Access Control (RBAC) is essential for securing your Kubernetes cluster. It ensures that only authorized users and services can access certain resources. When setting up Prometheus and Grafana, you need to configure RBAC permissions to allow these tools to access the necessary metrics and data.
Create a ServiceAccount for Prometheus and bind it to a ClusterRole with the required permissions:
apiVersion: v1
kind: ServiceAccount
metadata:
  name: prometheus
  namespace: monitoring
---
apiVersion: rbac.authorization.k8s.io/v1
kind: ClusterRoleBinding
metadata:
  name: prometheus
roleRef:
  apiGroup: rbac.authorization.k8s.io
  kind: ClusterRole
  name: prometheus
subjects:
- kind: ServiceAccount
  name: prometheus
  namespace: monitoring
Using Helm for Easy Deployment
Using Helm for deploying Prometheus and Grafana simplifies the process significantly. Helm charts provide pre-configured templates that you can customize according to your requirements. This approach ensures a consistent and repeatable deployment process.
To deploy Grafana using Helm, follow these steps:
-
Add the Grafana Helm repository:
helm repo add grafana https://grafana.github.io/helm-charts -
Update your Helm repositories:
helm repo update -
Install Grafana:
helm install grafana grafana/grafana
Deploying Prometheus in Kubernetes
Installing Prometheus with Helm
Deploying Prometheus with Helm ensures that all necessary components are correctly configured and deployed. The Helm chart for Prometheus includes everything you need to get started, including the Prometheus server, Alertmanager, and node exporters.
"Helm charts make deploying complex applications like Prometheus straightforward and manageable."
To install Prometheus using Helm, follow these steps:
-
Add the Prometheus Helm repository:
helm repo add prometheus-community https://prometheus-community.github.io/helm-charts -
Update your Helm repositories:
helm repo update -
Install Prometheus:
helm install prometheus prometheus-community/prometheus
Creating Custom ConfigMaps for Scraping
To tailor Prometheus to your specific needs, you can create custom ConfigMaps for scraping. ConfigMaps in Kubernetes allow you to manage configuration data separately from your application code. This separation makes it easier to update configurations without redeploying your applications.
For example, you can create a ConfigMap that defines the targets Prometheus should scrape:
apiVersion: v1
kind: ConfigMap
metadata:
  name: prometheus-config
  namespace: monitoring
data:
  prometheus.yml: |
    scrape_configs:
      - job_name: 'kubernetes-nodes'
        kubernetes_sd_configs:
          - role: node
Enabling Service Discovery for Dynamic Environments
Kubernetes environments are dynamic, with services being added, removed, or scaled frequently. Service discovery enables Prometheus to automatically detect and scrape new targets as they are created. This capability ensures that your monitoring setup remains up-to-date without manual intervention.
To enable service discovery, configure Prometheus to use Kubernetes service discovery:
scrape_configs:
  - job_name: 'kubernetes-services'
    kubernetes_sd_configs:
      - role: service
Visualizing Metrics with Grafana
Once Prometheus is set up and collecting metrics, the next step is to visualize these metrics using Grafana. Grafana's powerful visualization capabilities allow you to create dashboards that provide real-time insights into the performance and health of your Kubernetes cluster.
Connecting Grafana to Prometheus
Once Grafana is installed as outlined earlier, the next step is to connect it to Prometheus. This connection allows Grafana to query Prometheus for metrics and visualize them in dashboards.
To add Prometheus as a data source in Grafana:
-
Log in to the Grafana web interface.
-
Navigate to "Configuration" and select "Data Sources".
-
Click "Add data source" and select "Prometheus".
-
Enter the URL of your Prometheus server (e.g., http://prometheus-server.monitoring.svc.cluster.local).
-
Click "Save & Test" to verify the connection.
Creating Dashboards for Real-Time Insights
With Prometheus connected, you can now create custom dashboards in Grafana to visualize your Kubernetes metrics. Dashboards can include various panels such as graphs, tables, and heatmaps, providing a comprehensive view of your cluster's performance.
-
Navigate to "Dashboards" and click "New Dashboard".
-
Click "Add new panel" to create a new panel.
-
Select the type of visualization you want (e.g., graph, table).
-
Enter a Prometheus query to fetch the desired metrics (e.g., rate(http_requests_total[5m])).
-
Configure the panel settings and click "Apply".
-
Repeat the process to add more panels to your dashboard.
Setting Up Alerts for Proactive Monitoring
Setting up alerts is crucial for proactive monitoring. Alerts notify you of potential issues before they become critical, allowing you to take action promptly. Prometheus's Alertmanager handles alerting, sending notifications based on defined rules.
Configuring Alertmanager
Alertmanager manages alerts sent by Prometheus. It can group, deduplicate, and route alerts to various notification channels such as email, Slack, and PagerDuty.
To configure Alertmanager:
-
Create an Alertmanager configuration file:
global: resolve_timeout: 5mroute: receiver: 'default'receivers: - name: 'default' email_configs: - to: 'your-email@example.com' slack_configs: - api_url: 'https://hooks.slack.com/services/T00000000/B00000000/XXXXXXXXXXXXXXXXXXXXXXXX' -
Apply the configuration to your Alertmanager instance.
Creating Custom Alert Rules
Custom alert rules in Prometheus define the conditions under which alerts are triggered. These rules can be tailored to your specific requirements, ensuring that you are notified of the most relevant issues.
-
Create a Prometheus rule file:
groups:- name: example rules: - alert: HighRequestLatency expr: rate(http_request_duration_seconds_sum[5m]) / rate(http_request_duration_seconds_count[5m]) > 0.5 for: 5m labels: severity: 'critical' annotations: summary: 'High request latency detected' -
Apply the rule file to your Prometheus instance.
Integrating with Slack and Other Notification Channels
Integrating Alertmanager with notification channels like Slack ensures that alerts are delivered to the right people promptly. This integration helps in quick issue resolution and minimizes downtime.
"Integrating Alertmanager with Slack provides real-time alerts, ensuring that your team is always aware of potential issues."
To integrate Alertmanager with Slack:
-
Obtain a Slack webhook URL from your Slack workspace.
-
Add the webhook URL to your Alertmanager configuration:
receivers:- name: 'default' slack_configs: - api_url: 'https://hooks.slack.com/services/T00000000/B00000000/XXXXXXXXXXXXXXXXXXXXXXXX' channel: '#alerts' text: '{{ .CommonAnnotations.summary }}' -
Apply the updated configuration to your Alertmanager instance.
Best Practices for Optimizing Performance
Optimizing the performance of your monitoring setup ensures that Prometheus and Grafana can handle the load of a large Kubernetes cluster without degrading performance. Proper optimization involves fine-tuning configurations, scaling resources, and monitoring resource usage.
Fine-Tuning Prometheus Configurations
Fine-tuning Prometheus configurations can significantly improve its performance. Adjusting scrape intervals, retention periods, and resource limits ensures that Prometheus operates efficiently.
Key configurations to consider:
-
Scrape interval: Adjust the scrape interval to balance between data granularity and resource usage. For example:
scrape_interval: 15s -
Retention period: Set a retention period that aligns with your data retention policies. For example:
--storage.tsdb.retention.time=15d -
Resource limits: Allocate sufficient resources (CPU and memory) to the Prometheus server to handle the expected load.
Scaling Grafana for Larger Clusters
As your Kubernetes cluster grows, scaling Grafana becomes necessary to handle the increased load. Scaling Grafana involves adding more instances and configuring load balancing to distribute the load evenly.
"Scaling Grafana ensures that your dashboards remain responsive and can handle the increased load of a growing Kubernetes cluster."
-
Deploy multiple Grafana instances using a Deployment or StatefulSet.
-
Configure a LoadBalancer service to distribute traffic across Grafana instances.
-
Use persistent storage to ensure that dashboards and configurations are retained across instances.
Resource Allocation and Usage Monitoring
Monitoring resource allocation and usage is essential for maintaining the performance of your monitoring setup. Ensure that Prometheus and Grafana have sufficient resources and monitor their usage to identify potential bottlenecks.
To monitor resource usage:
-
Use Kubernetes metrics server to collect resource usage data.
-
Create Grafana dashboards to visualize resource usage metrics.
-
Set up alerts to notify you of resource usage exceeding thresholds.
Advanced Monitoring Techniques
Advanced monitoring techniques provide deeper insights into your Kubernetes cluster and help in identifying and resolving complex issues. These techniques include using Prometheus federation, implementing blackbox exporter, and leveraging Grafana Loki for log aggregation.
Using Prometheus Federation for Large Scale Environments
Prometheus federation is an effective way to scale your monitoring setup in large environments. It allows you to aggregate data from multiple Prometheus instances into a central server, providing a comprehensive view of your entire infrastructure. For a detailed guide on how to set this up, you can refer to this complete guide to using Prometheus and Grafana with Kubernetes.
To set up Prometheus federation:
-
Configure each Prometheus instance to scrape metrics from its local targets.
-
Set up a central Prometheus server to scrape metrics from the other Prometheus instances:
scrape_configs: - job_name: 'federate' honor_labels: true metrics_path: '/federate' params: 'match[]': - '{job="prometheus"}' static_configs: - targets: - 'prometheus-instance-1:9090' - 'prometheus-instance-2:9090'
Implementing Blackbox Exporter for Endpoint Monitoring
The Blackbox Exporter allows you to monitor the availability and performance of your endpoints. It supports various probe types, including HTTP, HTTPS, TCP, and ICMP, making it versatile for different monitoring needs.
To deploy the Blackbox Exporter:
-
Install the Blackbox Exporter using Helm:
helm install blackbox-exporter prometheus-community/prometheus-blackbox-exporter -
Configure Prometheus to scrape metrics from the Blackbox Exporter:
scrape_configs: - job_name: 'blackbox' metrics_path: /probe params: module: [http_2xx] static_configs: - targets: - http://example.com relabel_configs: - source_labels: [__address__] target_label: __param_target - source_labels: [__param_target] target_label: instance - target_label: __address__ replacement: blackbox-exporter:9115
Leveraging Grafana Loki for Log Aggregation
Grafana Loki is a log aggregation system designed to work with Grafana. It enables you to collect, query, and visualize logs alongside your metrics, providing a unified view of your system's performance.
To set up Grafana Loki:
-
Install Loki using Helm:
helm install loki grafana/loki-stack -
Configure Promtail to collect logs from your Kubernetes nodes:
scrape_configs: - job_name: system static_configs: - targets: - localhost labels: job: varlogs __path__: /var/log/*log -
Add Loki as a data source in Grafana:
apiVersion: v1kind: ConfigMapmetadata: name: grafana-datasources namespace: monitoringdata: datasources.yaml: | apiVersion: 1 datasources: - name: Loki type: loki url: http://loki:3100 access: proxy
Common Troubleshooting Tips
Even with a robust monitoring setup, issues can arise. Understanding common troubleshooting techniques can help you resolve problems quickly and maintain the reliability of your monitoring system.
Debugging Scraping Issues
Scraping issues can occur if Prometheus is unable to collect metrics from targets. Common causes include network connectivity problems, incorrect configurations, or targets being down.
To debug scraping issues:
-
Check the Prometheus logs for error messages related to scraping.
-
Verify that the target endpoints are reachable from the Prometheus server.
-
Ensure that the scrape configurations in Prometheus are correct.
-
Use the Prometheus web interface to manually query metrics and confirm data collection.
Handling High Cardinality Metrics
High cardinality metrics can cause performance issues in Prometheus due to the large number of unique time series they generate. To manage high cardinality:
-
Identify and reduce the number of unique labels in your metrics.
-
Use recording rules to precompute frequently queried metrics.
-
Implement relabeling to drop unnecessary labels before scraping.
Scaling Challenges and Solutions
As your Kubernetes cluster grows, scaling your monitoring setup becomes essential to handle the increased load. Common scaling challenges include resource limitations, increased data volume, and maintaining performance.
To address scaling challenges:
-
Increase the resources allocated to Prometheus and Grafana instances.
-
Implement Prometheus federation to distribute the load across multiple instances.
-
Optimize query performance by using recording rules and efficient queries.
-
Regularly review and adjust your monitoring setup to align with your cluster's growth.
Conclusion
Monitoring your Kubernetes cluster with Prometheus and Grafana is essential for maintaining performance and reliability. By following best practices for setup, configuration, and optimization, you can ensure that your monitoring system provides accurate and actionable insights.
Remember, continuous monitoring and regular updates to your monitoring setup are key to adapting to the evolving needs of your Kubernetes environment.
Importance of Continuous Monitoring
Continuous monitoring allows you to detect and resolve issues proactively, minimizing downtime and maintaining the performance of your applications. It provides the data needed to make informed decisions and optimize your infrastructure.
Therefore, investing in a robust monitoring setup with Prometheus and Grafana is a critical step towards achieving operational excellence in Kubernetes.
Future Trends in Kubernetes Monitoring
The future of Kubernetes monitoring is likely to see advancements in automation, machine learning, and integration with other observability tools. These trends will further enhance the ability to detect, diagnose, and resolve issues in real-time.
Staying updated with the latest developments and continuously improving your monitoring practices will ensure that you can leverage these advancements to maintain a high-performing Kubernetes environment.
Frequently Asked Questions
What is Prometheus and how does it work with Kubernetes?
Prometheus is an open-source monitoring and alerting toolkit designed for reliability and scalability. In Kubernetes, Prometheus collects metrics from various components, such as nodes, pods, and services, providing a comprehensive view of the cluster's performance. It uses service discovery to dynamically identify targets and scrape metrics at specified intervals.
How do I set up basic monitoring for a Kubernetes cluster?
To set up basic monitoring for a Kubernetes cluster, you need to deploy Prometheus and Grafana. Start by installing the Prometheus Operator and configuring RBAC permissions. Use Helm to deploy Prometheus and Grafana, and connect Grafana to Prometheus as a data source. Create custom dashboards in Grafana to visualize the collected metrics.