Key Takeaways
-
Setting up Prometheus and Grafana for Kubernetes monitoring involves deploying Helm and Kustomize for configuration management.
-
Prometheus is a powerful tool for monitoring Kubernetes due to its dynamic service discovery and robust alerting capabilities.
-
Effective monitoring requires understanding Prometheus configuration, setting up scrape configurations, and creating alerting rules.
-
Integrating Grafana with Prometheus allows for customizable and insightful dashboards to visualize metrics.
-
Monitoring Kubernetes services, nodes, pods, and applications ensures better performance and reliability of your cloud infrastructure.
Mastering Kubernetes Monitoring: An In-Depth Guide to Prometheus
The Importance of Monitoring in Kubernetes
Monitoring is a crucial aspect of managing Kubernetes clusters. It ensures that you can track the performance, health, and reliability of your applications and infrastructure. Without proper monitoring, diagnosing issues becomes nearly impossible, leading to prolonged downtimes and frustrated users.
In a dynamic environment like Kubernetes, where services and pods are constantly scaling and shifting, having a robust monitoring solution is indispensable. It helps in identifying bottlenecks, optimizing resource usage, and maintaining overall system health.
Why Choose Prometheus for Kubernetes Monitoring?
Prometheus is a popular choice for monitoring Kubernetes environments due to its cloud-native design and seamless integration with Kubernetes. Here are a few reasons why Prometheus stands out:
-
Dynamic Service Discovery: Prometheus can automatically discover services and pods within your Kubernetes cluster, making it easy to monitor a constantly changing environment.
-
Powerful Query Language: Prometheus uses PromQL, a flexible query language that allows you to aggregate and analyze metrics effectively.
-
Robust Alerting: Prometheus integrates with Alertmanager to provide robust alerting capabilities, ensuring you are notified of issues promptly.
-
Extensibility: Prometheus supports various exporters that can be used to monitor different services and applications.
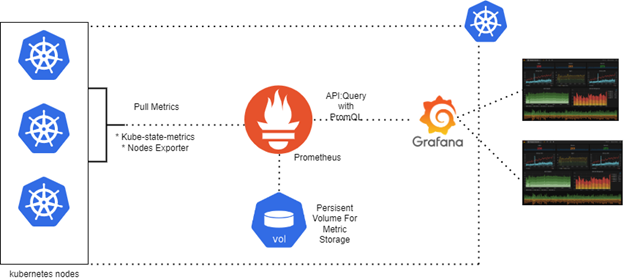
"Grafana & Prometheus Kubernetes Cluster ..." from earthly.dev and used with no modifications.
Setting Up Your Environment
Before diving into the configuration and deployment of Prometheus and Grafana, it's essential to set up your environment properly. This involves preparing your Kubernetes cluster, ensuring system compatibility, and installing necessary tools.
Preparing Your Kubernetes Cluster
Start by ensuring your Kubernetes cluster is up and running. You can use managed Kubernetes services like Google Kubernetes Engine (GKE), Amazon Elastic Kubernetes Service (EKS), or Azure Kubernetes Service (AKS) for a hassle-free setup. If you prefer to run Kubernetes on-premises, tools like kubeadm can help you get started.
System Requirements and Compatibility
Ensure your system meets the following requirements for deploying Prometheus and Grafana.
-
Kubernetes Version: Ensure your cluster is running Kubernetes version 1.16 or later.
-
Helm: Install Helm, a package manager for Kubernetes, to simplify the deployment of Prometheus and Grafana, or better still you could use werf, but helm is fine to start with.
-
Kustomize: Kustomize is a configuration management tool that allows you to customize Kubernetes resources. Ensure it is installed and configured.
Installing Necessary Tools (Helm, Kustomize)
To install Helm, follow these steps:
-
Download Helm from the official website.
-
Install Helm by following the installation instructions for your operating system.
-
Initialize Helm in your Kubernetes cluster by running:
helm init
To install Kustomize, follow these steps:
-
Download Kustomize from the official GitHub repository.
-
Install Kustomize by following the installation instructions for your operating system.
Deploying Prometheus and Grafana
With Helm and Kustomize installed, you can now deploy Prometheus and Grafana in your Kubernetes cluster. Use the following Helm commands to deploy Prometheus:
helm repo add prometheus-community https://prometheus-community.github.io/helm-charts helm repo update helm install prometheus prometheus-community/prometheus
Next, deploy Grafana using Helm:
helm repo add grafana https://grafana.github.io/helm-charts helm repo update helm install grafana grafana/grafana
These commands will deploy Prometheus and Grafana in your Kubernetes cluster, making them ready for further configuration.
Configuring Prometheus for Kubernetes
Now that Prometheus and Grafana are deployed, it's time to configure Prometheus to monitor your Kubernetes cluster effectively.
Understanding Prometheus Configuration
Prometheus configuration involves setting up scrape jobs, defining alerting rules, and configuring service discovery. The main configuration file for Prometheus is prometheus.yml, which contains all the necessary settings.
Here are some key sections of the prometheus.yml file:
-
global: This section defines global settings like scrape interval and evaluation interval.
-
scrape_configs: This section defines the targets that Prometheus will scrape metrics from.
-
alerting: This section defines alerting rules and configurations for Alertmanager.
Enabling Kubernetes Service Discovery
Prometheus can automatically discover services and pods within your Kubernetes cluster using Kubernetes service discovery. To enable this, add the following configuration to your prometheus.yml file:
scrape_configs: - job_name: 'kubernetes-apiservers' kubernetes_sd_configs: - role: endpoints - job_name: 'kubernetes-nodes' kubernetes_sd_configs: - role: node - job_name: 'kubernetes-pods' kubernetes_sd_configs: - role: pod
This configuration will enable Prometheus to discover and scrape metrics from Kubernetes API servers, nodes, and pods.
Setting Up Scrape Configurations
Scrape configurations in Prometheus define how and where Prometheus will gather metrics. These configurations are specified in the scrape_configs section of the prometheus.yml file. To set up a basic scrape configuration, you need to specify the job name and the targets you want to scrape.
Here is an example of a simple scrape configuration for scraping metrics from a Kubernetes service:
scrape_configs: - job_name: 'kubernetes-service' kubernetes_sd_configs: - role: service relabel_configs: - source_labels: [__meta_kubernetes_service_label_app] action: keep regex: my-app
This configuration tells Prometheus to scrape metrics from services in your Kubernetes cluster that have the label app=my-app. You can customize the relabel_configs section to match your specific needs.
Creating Alerting Rules
Alerting is a crucial feature in Prometheus that helps you stay informed about potential issues in your Kubernetes cluster. You can define alerting rules in the alerting_rules.yml file and then configure Prometheus to use these rules.
Here is an example of an alerting rule that triggers an alert if a Kubernetes node has a high CPU usage:
groups: - name: kubernetes-alerts rules: - alert: HighCPUUsage expr: sum(rate(container_cpu_usage_seconds_total[5m])) by (node) > 0.8 for: 5m labels: severity: critical annotations: summary: "High CPU usage on node {{ $labels.node }}" description: "Node {{ $labels.node }} has a high CPU usage for more than 5 minutes."
This rule checks if the CPU usage on any node exceeds 80% for more than 5 minutes and triggers an alert if the condition is met. The alert includes labels and annotations to provide additional context.
Monitoring Kubernetes Services with Prometheus
Once Prometheus is configured, you can start monitoring various aspects of your Kubernetes cluster, including nodes, pods, and applications. This section will guide you through monitoring different components of your cluster.
Monitoring Nodes and Pods
Monitoring nodes and pods is essential for understanding the resource usage and performance of your Kubernetes cluster. Prometheus can scrape metrics from the Kubernetes nodes and pods, providing insights into CPU, memory, and network usage. For those looking to expand their monitoring capabilities, you might consider boosting productivity with Krew plugins.
To monitor nodes, ensure you have the following scrape configuration in your prometheus.yml file:
scrape_configs: - job_name: 'kubernetes-nodes' kubernetes_sd_configs: - role: node
Similarly, to monitor pods, use the following configuration:
scrape_configs: - job_name: 'kubernetes-pods' kubernetes_sd_configs: - role: pod
These configurations will enable Prometheus to scrape metrics from all nodes and pods in your Kubernetes cluster.
Monitoring Internal Kubernetes Components
Besides nodes and pods, it's crucial to monitor the internal components of Kubernetes, such as the API server, controller manager, and scheduler. These components are vital for the proper functioning of your cluster.
Add the following configuration to your prometheus.yml file to monitor the Kubernetes API server:
scrape_configs: - job_name: 'kubernetes-apiservers' kubernetes_sd_configs: - role: endpoints relabel_configs: - source_labels: [__meta_kubernetes_namespace, __meta_kubernetes_service_name, __meta_kubernetes_endpoint_port_name] action: keep regex: default;kubernetes;https
This configuration scrapes metrics from the Kubernetes API server endpoint. You can add similar configurations for other internal components by modifying the role and relabel_configs sections as needed.
Monitoring Kubernetes Applications
Monitoring applications running within your Kubernetes cluster is essential to ensure they are performing as expected. Prometheus can scrape metrics from application endpoints, providing insights into their health and performance.
For example, if you have a web application exposing metrics at /metrics, you can configure Prometheus to scrape these metrics using the following configuration:
scrape_configs: - job_name: 'my-web-app' kubernetes_sd_configs: - role: pod relabel_configs: - source_labels: [__meta_kubernetes_pod_label_app] action: keep regex: my-web-app - source_labels: [__meta_kubernetes_pod_annotation_prometheus_io_scrape] action: keep regex: true - source_labels: [__meta_kubernetes_pod_annotation_prometheus_io_path] target_label: __metrics_path__ regex: (.+) - source_labels: [__address__, __meta_kubernetes_pod_annotation_prometheus_io_port] target_label: __address__ regex: (.+):(?:\d+);(\d+) replacement: ${1}:${2}
This configuration tells Prometheus to scrape metrics from pods labeled app=my-web-app and having the annotation prometheus.io/scrape=true. The relabel_configs section ensures that Prometheus scrapes metrics from the correct endpoint and port.
Database Monitoring within Kubernetes
Databases are critical components of many applications, and monitoring their performance is essential for ensuring application reliability. Prometheus can monitor databases running within your Kubernetes cluster using exporters.
For example, to monitor a MySQL database, you can use the MySQL exporter. Deploy the MySQL exporter in your Kubernetes cluster and configure Prometheus to scrape metrics from it. If you're looking for a comprehensive guide on Kubernetes deployments, check out this article on zero-downtime deployment in Kubernetes.
scrape_configs: - job_name: 'mysql' static_configs: - targets: ['mysql-exporter:9104']
This configuration tells Prometheus to scrape metrics from the MySQL exporter running at mysql-exporter:9104. You can deploy similar exporters for other databases like PostgreSQL, MongoDB, and Redis.
Creating and Customizing Dashboards with Grafana
Grafana is a powerful visualization tool that integrates seamlessly with Prometheus. It allows you to create customizable dashboards to visualize the metrics collected by Prometheus. In this section, we will cover the steps to integrate Grafana with Prometheus and create your first dashboard.
Integrating Grafana with Prometheus
To integrate Grafana with Prometheus, follow these steps:
-
Log in to the Grafana web interface using the default credentials (username:
admin, password:admin). -
Navigate to Configuration > Data Sources.
-
Click Add data source and select Prometheus.
-
Enter the URL of your Prometheus server (e.g.,
http://prometheus-server:9090). -
Click Save & Test to verify the connection.
Once Grafana is connected to Prometheus, you can start creating dashboards to visualize your metrics.
Building Your First Dashboard
Creating a dashboard in Grafana is straightforward. Follow these steps to build your first dashboard:
-
Navigate to Create > Dashboard.
-
Click Add new panel to add a new panel to your dashboard.
-
Select the Prometheus data source.
-
Enter a PromQL query to fetch the desired metrics (e.g.,
sum(rate(container_cpu_usage_seconds_total[5m])) by (pod)). -
Customize the panel by adjusting the visualization type, title, and other settings.
-
Click Apply to save the panel.
Repeat these steps to add more panels and build a comprehensive dashboard that provides insights into your Kubernetes cluster's performance.
Customizing Visuals and Panels
Grafana offers various customization options to enhance the visual appeal and readability of your dashboards. Here are some tips for customizing your visuals and panels:
-
Visualization Types: Choose from different visualization types like graphs, tables, gauges, and heatmaps to represent your data effectively.
-
Panel Titles: Use descriptive titles for your panels to make it clear what each panel represents.
-
Thresholds and Alerts: Set thresholds and alerts on your panels to highlight critical metrics and receive notifications when certain conditions are met.
-
Templating: Use template variables to create dynamic dashboards that can be easily reused and customized.
By leveraging these customization options, you can create dashboards that provide valuable insights and help you make informed decisions about your Kubernetes cluster.
Specialized Monitoring Solutions
Besides general monitoring, you may need specialized monitoring solutions for specific types of applications and workloads within your Kubernetes cluster. This section will cover monitoring stateful applications, microservices, and security and compliance.
Monitoring Stateful Applications
Stateful applications, such as databases and message queues, require special attention due to their persistent nature and complex state management. Prometheus can monitor stateful applications using specialized exporters and configurations.
For example, to monitor a Cassandra database, you can use the Cassandra exporter. Deploy the Cassandra exporter in your Kubernetes cluster and configure Prometheus to scrape metrics from it.
scrape_configs: - job_name: 'cassandra' static_configs: - targets: ['cassandra-exporter:8080']
This configuration tells Prometheus to scrape metrics from the Cassandra exporter running at cassandra-exporter:8080. Similar exporters are available for other stateful applications like Kafka, RabbitMQ, and Elasticsearch.
Observability for Microservices
Microservices architectures introduce additional complexity due to the distributed nature of services. Monitoring microservices requires collecting and correlating metrics, logs, and traces from multiple services.
Prometheus, combined with tools like Jaeger for tracing and Fluentd for log aggregation, can provide comprehensive observability for microservices. Use the following configuration to integrate Jaeger with Prometheus:
scrape_configs: - job_name: 'jaeger' static_configs: - targets: ['jaeger-agent:14268']
This configuration tells Prometheus to scrape metrics from the Jaeger agent running at jaeger-agent:14268. By integrating these tools, you can gain deep insights into the performance and behavior of your microservices.
Monitoring Security and Compliance
Ensuring the security and compliance of your Kubernetes cluster is critical for protecting sensitive data and meeting regulatory requirements. Prometheus can monitor security-related metrics and integrate with security tools to provide comprehensive monitoring. For more advanced techniques, consider exploring Kubernetes plugins that can boost productivity and enhance security measures.
For example, to monitor security events using Falco, deploy the Falco exporter in your Kubernetes cluster and configure Prometheus to scrape metrics from it.
scrape_configs: - job_name: 'falco' static_configs: - targets: ['falco-exporter:9376']
This configuration tells Prometheus to scrape metrics from the Falco exporter running at falco-exporter:9376. By monitoring security events and integrating with security tools, you can ensure your Kubernetes cluster remains secure and compliant.
Best Practices for Effective Kubernetes Monitoring
Effective monitoring of your Kubernetes environment requires adhering to best practices that ensure reliability, scalability, and maintainability. By following these guidelines, you can optimize your monitoring setup and make the most of Prometheus and Grafana.
Implementing these best practices will help you avoid common pitfalls and enhance the performance and reliability of your monitoring solution.
Maintenance and Optimization Tips
Regular maintenance and optimization are crucial for keeping your monitoring system running smoothly. Here are some tips to help you maintain and optimize your Prometheus and Grafana setup:
-
Regularly Update: Keep Prometheus, Grafana, and their exporters up to date to benefit from the latest features, improvements, and security patches.
-
Resource Management: Monitor the resource usage of Prometheus and Grafana to ensure they are not consuming excessive CPU or memory. Adjust resource limits and requests as needed.
-
Retention Policies: Configure data retention policies in Prometheus to manage the storage of historical metrics. This helps prevent excessive disk usage and ensures the system remains performant.
-
Backup Configurations: Regularly back up your Prometheus and Grafana configurations, including dashboards and alerting rules, to prevent data loss.
Troubleshooting Common Issues
Despite careful planning, issues can arise in your monitoring setup. Here are some common problems and their solutions:
-
High Cardinality: High cardinality metrics can cause performance issues in Prometheus. Identify and reduce high cardinality metrics by aggregating or filtering unnecessary labels.
-
Scrape Failures: If Prometheus fails to scrape metrics from a target, check the target's endpoint, network connectivity, and scrape configurations. Ensure the target is exposing metrics correctly.
-
Alert Fatigue: Too many alerts can lead to alert fatigue. Review and refine your alerting rules to focus on critical issues and reduce noise.
-
Dashboard Performance: If Grafana dashboards are slow, optimize PromQL queries, reduce the number of panels, and use template variables to improve performance.
Scalability Considerations
As your Kubernetes cluster grows, your monitoring setup must scale accordingly. Here are some considerations for scaling your Prometheus and Grafana deployment:
-
Federation: Use Prometheus federation to scale horizontally by splitting metrics collection across multiple Prometheus instances and aggregating data in a central instance.
-
Sharding: Shard your metrics collection by distributing scrape jobs across multiple Prometheus instances to balance the load.
-
Long-Term Storage: Integrate Prometheus with long-term storage solutions like Thanos or Cortex to store and query historical metrics efficiently.
-
Load Balancing: Use load balancers to distribute traffic to Grafana and Prometheus instances, ensuring high availability and reliability.
Conclusion: Empowering Your Kubernetes Operations
By mastering Kubernetes monitoring with Prometheus and Grafana, you can gain deep insights into your cluster's performance and health. This empowers you to make informed decisions, optimize resource usage, and ensure the reliability of your applications.
Implementing the best practices, maintenance tips, and troubleshooting strategies discussed in this guide will help you build a robust and scalable monitoring solution for your Kubernetes environment.
Final Thoughts on Kubernetes Monitoring
Kubernetes monitoring is an ongoing process that requires continuous improvement and adaptation. Stay proactive in refining your monitoring setup, and leverage the power of Prometheus and Grafana to achieve optimal results.
Staying Updated and Engaged with the Community
Engage with the Kubernetes and Prometheus communities to stay updated on the latest developments, best practices, and tools. Participate in forums, attend webinars, and contribute to open-source projects to enhance your knowledge and skills.
Frequently Asked Questions (FAQ)
How do I start monitoring a new service in Kubernetes?
To start monitoring a new service in Kubernetes, deploy the service with the appropriate annotations for Prometheus to scrape metrics. Update your prometheus.yml file to include a scrape configuration for the new service.
Can Prometheus and Grafana monitor other services outside Kubernetes?
Yes, Prometheus and Grafana can monitor services outside Kubernetes. Configure Prometheus to scrape metrics from external targets and use Grafana to visualize the collected data.
What are the most common issues faced while monitoring Kubernetes?
Common issues include high cardinality metrics, scrape failures, alert fatigue, and dashboard performance problems. Address these issues by optimizing configurations, refining alerting rules, and scaling your monitoring setup.
How can I improve the performance of my monitoring setup?
Improve performance by optimizing PromQL queries, reducing high cardinality metrics, distributing scrape jobs, and using long-term storage solutions. Regularly review and adjust resource limits for Prometheus and Grafana.