Key Takeaways
Misconfigured network policies can block legitimate traffic, causing connectivity issues between pods or preventing access to external services.
Initial diagnostic steps include collecting pod status information, inspecting network policies, and reviewing events and logs.
Advanced troubleshooting involves verifying pod IP assignments, inspecting network plugin configurations, evaluating firewall rules, and performing DNS resolution checks.
Regular network health checks, proper monitoring and alerting, and clear documentation are best practices in network policy management.
Securing pod-to-pod communication and encrypting traffic with TLS and mutual authentication are crucial for maintaining network security.
How to Diagnose Network Policy Issues in Your Kubernetes Cluster
Recognize Network Policy Symptoms
Diagnosing network policy issues in a Kubernetes cluster can seem daunting, but recognizing the symptoms is the first step. Common signs that indicate network policy problems include pods unable to communicate, services not accessible, and intermittent connectivity problems.

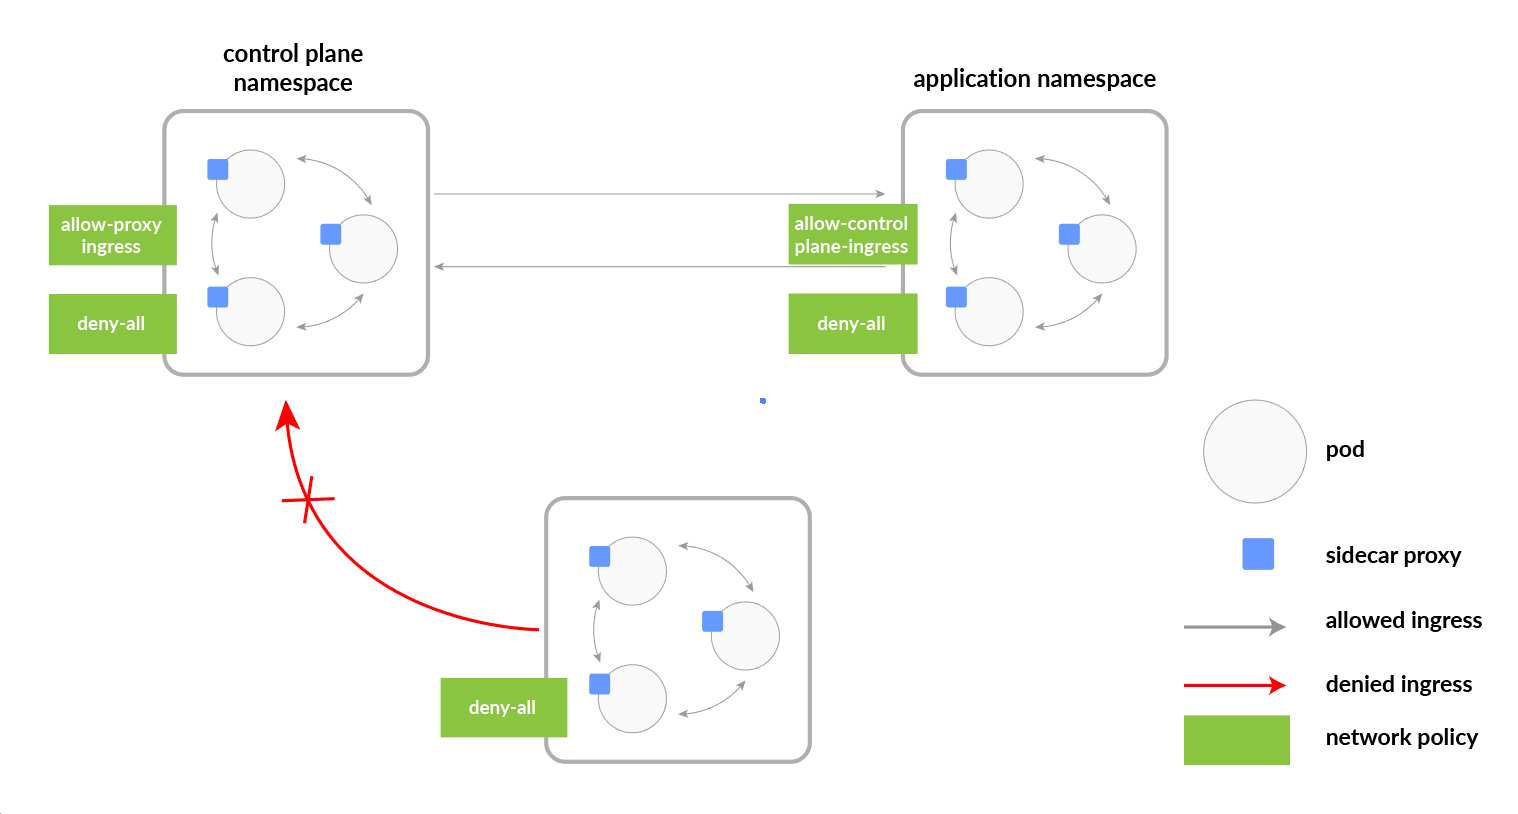
“Kubernetes network policy | Why network …” from k21academy.com and used with no modifications.
Common Signs of Network Policy Issues
Understanding the common signs of network policy issues can help you quickly identify and resolve problems. Here are some typical symptoms:
Pods unable to communicate
Services not accessible
Intermittent connectivity problems
Pods Unable to Communicate
One of the most obvious signs of network policy issues is when pods cannot communicate with each other. This can manifest in various ways, such as failed API calls, timeouts, or connection refusals.
For instance, if your application consists of multiple microservices running in different pods, a misconfigured network policy might prevent these pods from talking to each other. This can lead to errors in your application and affect its overall functionality.
Services Not Accessible
Another common sign of network policy issues is when services are not accessible. This can happen when network policies block traffic to or from specific services, preventing them from functioning correctly.
Check if the service selectors are correctly defined.
Verify that the network policies allow traffic to and from the service.
Intermittent Connectivity Problems
Intermittent connectivity problems can be challenging to diagnose because they may not always be consistent. These issues can occur due to network congestion, misconfigured policies, or resource limitations. For more insights, you can read about solving common Kubernetes issues.
Monitoring network traffic and analyzing logs can help you identify patterns and pinpoint the root cause of intermittent connectivity problems.
Initial Diagnostic Steps
When diagnosing network policy issues, it’s essential to start with some initial diagnostic steps. These steps will help you gather the necessary information to identify and resolve the problem.
Collecting Pod Status Information
The first step in diagnosing network policy issues is to collect information about the status of your pods. This can be done using the following commands:
For troubleshooting Kubernetes networking issues, you can start by running
kubectl get pods
kubectl describe pod my-pod
kubectl logs my-podThese commands will provide you with details about the state of your pods, any events related to them, and their logs. This information can help you identify any issues that may be affecting pod communication.
Inspecting Network Policies
Next, you should inspect your network policies to ensure they are correctly configured. Use the following command to describe a specific network policy:
kubectl describe networkpolicy my-network-policy
This command will display the details of the network policy, including its rules and selectors. Review these details to ensure the policy is not blocking legitimate traffic.
Reviewing Events and Logs
Reviewing events and logs is another crucial step in diagnosing network policy issues. Events and logs can provide valuable insights into what is happening within your cluster and help you identify any anomalies or errors.
Use the following command to review events related to a specific pod:
kubectl describe pod my-pod
Additionally, you can review the logs of a specific pod using the following command:
kubectl logs my-podBy analyzing events and logs, you can identify patterns and pinpoint the root cause of network policy issues.
Inspect Network Plugin Configuration
Network plugins play a crucial role in Kubernetes by managing the intricate process of assigning IP addresses to pods and handling routing and network policy enforcement. If there’s an issue with your network plugin configuration, it can lead to significant connectivity problems between pods.
To inspect the network plugin configuration, you can use the following command:
kubectl get nodes -o wideThis command will provide information about the network configuration of your nodes. Ensure that the network plugin is correctly installed and configured on all nodes. Common network plugins include Calico, Flannel, and Weave.
Check the documentation of your network plugin for specific configuration details.
Ensure that the plugin is compatible with your Kubernetes version.
Verify that all nodes have the same network plugin version installed.
Inspecting the network plugin configuration can help you identify any discrepancies that might be causing network policy issues.
Evaluate Firewall Rules
Firewall rules are critical for controlling network traffic and ensuring security. However, misconfigured firewall rules can block legitimate traffic, causing connectivity issues between pods or preventing access to external services. Evaluating your firewall rules is an essential step in diagnosing network policy issues.
DNS Resolution Checks
DNS resolution is vital for service discovery in Kubernetes. If DNS is not correctly configured, pods may fail to resolve service names, leading to connectivity issues. To verify DNS configuration in your cluster, you can use the following command:
kubectl exec -ti dnsutils -- nslookup kubernetes.defaultThis command will check if the DNS service is correctly resolving the Kubernetes service name. If the command fails, it indicates a DNS configuration issue that needs to be addressed.
Additionally, you can review the DNS logs to identify any errors or issues:
kubectl logs -n kube-system -l k8s-app=kube-dnsService Discovery Tests
Service discovery is essential for pods to communicate with each other and with external services. If services are not correctly defined or if selectors are mismatched, pods may fail to discover and communicate with each other. To test service discovery, you can use tools like curl or Wget for manual checks:
kubectl exec -ti my-pod -- curl http://my-serviceThis command will attempt to access the service from within a pod. If the command fails, it indicates an issue with service discovery that needs to be resolved.
Here’s a quick example to illustrate:
Suppose you have a service named “my-service” and a pod named “my-pod.” If “my-pod” cannot access “my-service,” you can use the following command to test the connection:
kubectl exec -ti my-pod -- curl http://my-service.If the connection fails, it indicates a problem with the service definition or network policy.
By performing these tests, you can identify and resolve issues related to service discovery in your Kubernetes cluster.
Network Congestion and Latency
Network congestion and latency can significantly impact the performance of your Kubernetes cluster. Identifying and addressing these issues is crucial for maintaining a healthy network environment.
Monitoring network traffic and adjusting resource limits are two effective strategies for managing network congestion and latency. For more troubleshooting tips, you can explore Datadog Kubernetes monitoring and troubleshooting.
Monitoring Network Traffic
Monitoring network traffic can help you identify patterns and pinpoint the root cause of network congestion. Tools like Prometheus and Grafana can provide valuable insights into network traffic and performance.
Set up network monitoring to track metrics such as:
Network throughput
Packet loss
Latency
Connection errors
By monitoring these metrics, you can identify and address network congestion before it becomes a significant issue.
Adjusting Resource Limits
Adjusting resource limits can help alleviate network congestion and improve performance. Kubernetes allows you to set resource limits on pods to ensure they do not consume excessive resources.
To set resource limits, you can use the following configuration in your pod definition:
apiVersion: v1
kind: Pod
metadata:
name: my-pod
spec:
containers:
- name: my-container
resources:
limits:
memory: "256Mi"
cpu: "250m"
memory: "128Mi"By setting resource limits, you can prevent individual pods from consuming excessive resources, which can help reduce network congestion and improve overall performance. Learn more about automated solutions for pod eviction issues in Kubernetes.
Best Practices in Network Policy Management
Implementing best practices in network policy management can help you maintain a healthy and secure network environment in your Kubernetes cluster. Here are some essential best practices to follow:
Proper Monitoring and Alerting
Proper monitoring and alerting are crucial for identifying and addressing network issues before they become significant problems. Set up monitoring tools like Prometheus and Grafana to track network metrics and configure alerts to notify you of any anomalies.
Regular Network Health Checks
Regular network health checks can help you identify and address potential issues before they impact your cluster. Perform routine checks to ensure that your network policies, firewall rules, and DNS configurations are correctly configured and functioning as expected.
Here are some steps for regular network health checks:
Verify network policy configurations
Check firewall rules and ensure they are not blocking legitimate traffic
Test DNS resolution and service discovery
Monitor network traffic and performance metrics
Clear Documentation
Clear documentation is essential for maintaining a well-managed network environment. Document your network configurations, policies, and troubleshooting procedures for your team to reference. Collaboration with network administrators and developers can enhance your understanding and ability to handle networking issues.
Document network policy configurations
Maintain a record of firewall rules and their purposes
Keep a log of any network changes and their impacts
Clear documentation ensures that everyone on your team is on the same page and can quickly identify and resolve network issues.
Besides that, leveraging automation tools can significantly enhance the efficiency and reliability of your network policy management. Automation tools can help you enforce consistent policies, monitor compliance, and quickly identify and resolve issues.
Network Security Considerations
Ensuring network security is another crucial factor in any Kubernetes deployment. Below are some important security considerations you need to keep in mind.
Securing Pod-to-Pod Communication
Network policies are essential for controlling the flow of traffic between pods in your cluster. They enable you to enforce which pods or IP ranges can access your applications. For more insights on managing Kubernetes issues, check out this article on solving common Kubernetes issues in Azure AKS.
Define network policies to allow only necessary traffic between pods.
Regularly review and update network policies to adapt to changes in your cluster.
Use namespaces to isolate different environments and apply network policies at the namespace level.
Securing pod-to-pod communication ensures that your applications are protected from unauthorized access and potential security threats. Learn more about Kubernetes secrets management best practices to enhance your cluster’s security.
For example, you can create a network policy to allow traffic only from specific pods, which is one of the common Kubernetes issues that can be solved.
apiVersion: networking.k8s.io/v1.
kind: NetworkPolicy
name: allow-specific-pods
namespace: my-namespace
spec:
matchLabels:
app: my-app
policyTypes:
- Ingress
- from:
- podSelector:
role: frontendFor those looking to enhance their Kubernetes monitoring, consider exploring this guide to Datadog Kubernetes monitoring for troubleshooting tips and best practices.
Encrypting Traffic with TLS and Mutual Authentication
Encrypting traffic between pods and services is crucial for protecting sensitive data and ensuring secure communication. Using Transport Layer Security (TLS) and mutual authentication can help achieve this goal.
To encrypt traffic with TLS, you need to generate certificates and configure your applications to use them. Here’s a basic example of how to set up TLS encryption:
apiVersion: v1
kind: Secret
metadata:
name: tls-secret
namespace: my-namespace
data:
tls.key: base64-encoded-key
type: kubernetes.io/tlsOnce you have the TLS secret, you can configure your application to use it for encrypted communication. Additionally, mutual authentication ensures that both parties in the communication verify each other’s identity, adding an extra layer of security.
Generate and manage TLS certificates for your applications.
Configure your applications to use TLS for encrypted communication.
Implement mutual authentication to verify the identity of both parties in the communication.
By encrypting traffic with TLS and implementing mutual authentication, you can ensure secure communication between your pods and services.
Final Thoughts
Diagnosing network policy issues in your Kubernetes cluster can be challenging, but with the right approach and tools, you can quickly identify and resolve problems. By following the steps outlined in this article, you can ensure a healthy and secure network environment for your applications.
Recap of Critical Steps
Here are the critical steps to diagnose and resolve network policy issues:
Recognize common signs of network policy issues, such as pods unable to communicate, services not accessible, and intermittent connectivity problems.
Collect pod status information using commands like kubectl get pods, kubectl describe pod, and kubectl logs.
Inspect network policies with kubectl describe networkpolicy to ensure they are correctly configured.
Review events and logs to identify any anomalies or errors.
Verify pod IP assignments and inspect network plugin configurations.
Evaluate firewall rules to ensure they are not blocking legitimate traffic.
Perform DNS resolution checks and service discovery tests to ensure proper communication between pods and services.
Monitor network traffic and adjust resource limits to manage network congestion and latency.
Implement best practices in network policy management, including proper monitoring and alerting, regular network health checks, and clear documentation.
Ensure network security by securing pod-to-pod communication and encrypting traffic with TLS and mutual authentication.
Following these steps will help you maintain a robust and secure Kubernetes network environment.
Importance of Proactive Management
Proactive management of network policies and configurations is crucial for preventing issues before they impact your cluster. Regularly review and update your network policies, monitor network traffic, and perform health checks to ensure a healthy and secure network environment.
By staying proactive, you can quickly identify and resolve potential issues, ensuring that your applications run smoothly and securely.
Frequently Asked Questions (FAQ)
Here are some frequently asked questions about diagnosing network policy issues in Kubernetes:
What is a Kubernetes Network Policy?
A Kubernetes Network Policy is a specification that defines how groups of pods are allowed to communicate with each other and other network endpoints. Network policies use labels to select pods and define rules for ingress and egress traffic.
Network policies are essential for controlling the flow of traffic in your cluster and ensuring the security of your applications. To further enhance your cluster’s security, consider implementing best practices for Kubernetes secrets management.
Network policies are defined using YAML files.
They can specify ingress and egress rules based on pod selectors, IP blocks, and namespaces.
Network policies are enforced by the network plugin used in your cluster.
How do I know if my NetworkPolicy is correctly implemented?
To verify if your NetworkPolicy is correctly implemented, you can use the following steps:
Use kubectl describe networkpolicy to review the details of the policy.
Check if the policy selectors and rules match the intended configuration.
Test pod communication by sending traffic between pods that should be allowed or blocked by the policy.
Review events and logs for any errors or anomalies related to the network policy.
By following these steps, you can ensure that your NetworkPolicy is correctly implemented and functioning as expected. For more insights on troubleshooting Kubernetes, you can refer to this guide on Kubernetes monitoring and troubleshooting.
In conclusion, diagnosing network policy issues in your Kubernetes cluster requires a systematic approach and a thorough understanding of your network configurations. By recognizing common signs of network policy problems, performing initial diagnostic steps, and implementing advanced troubleshooting techniques, you can quickly identify and resolve issues. Additionally, following best practices in network policy management and ensuring network security will help you maintain a robust and secure Kubernetes environment for your applications.


