Key Takeaways
Proactive monitoring helps identify and resolve Kubernetes issues before they escalate.
Common critical issues in Kubernetes include pod failures, node resource exhaustion, and networking problems.
Datadog provides tools like the Datadog Operator and DatadogMonitor CRD to automate monitoring.
Setting up custom alerts with Datadog ensures quick response to potential issues.
Real-world case studies show significant improvements in uptime and issue resolution using Datadog.
Proactive Monitoring Strategies to Prevent Critical Kubernetes Issues with Datadog
Kubernetes is a powerful system for managing containerized applications, but it comes with its own set of challenges. To ensure smooth operations, proactive monitoring is crucial. Datadog offers a comprehensive suite of tools to help you stay ahead of potential issues.
Why Proactive Monitoring Matters in Kubernetes Environments
Proactive monitoring is essential because it helps you identify and resolve issues before they impact your applications. Kubernetes environments are dynamic and can change rapidly, making it difficult to keep track of everything manually. By setting up automated monitoring, you can ensure that your system remains stable and performant.
Overview of Kubernetes Challenges and Solutions
Kubernetes simplifies the deployment and management of containerized applications, but it also introduces complexity. Some of the common challenges include:
Pod failures and CrashLoopBackOff states
Node resource limitations and exhaustion
Networking and connectivity issues
Service downtime and latency
Each of these issues can significantly impact your application’s performance and availability. Therefore, it’s important to have a robust monitoring solution in place.

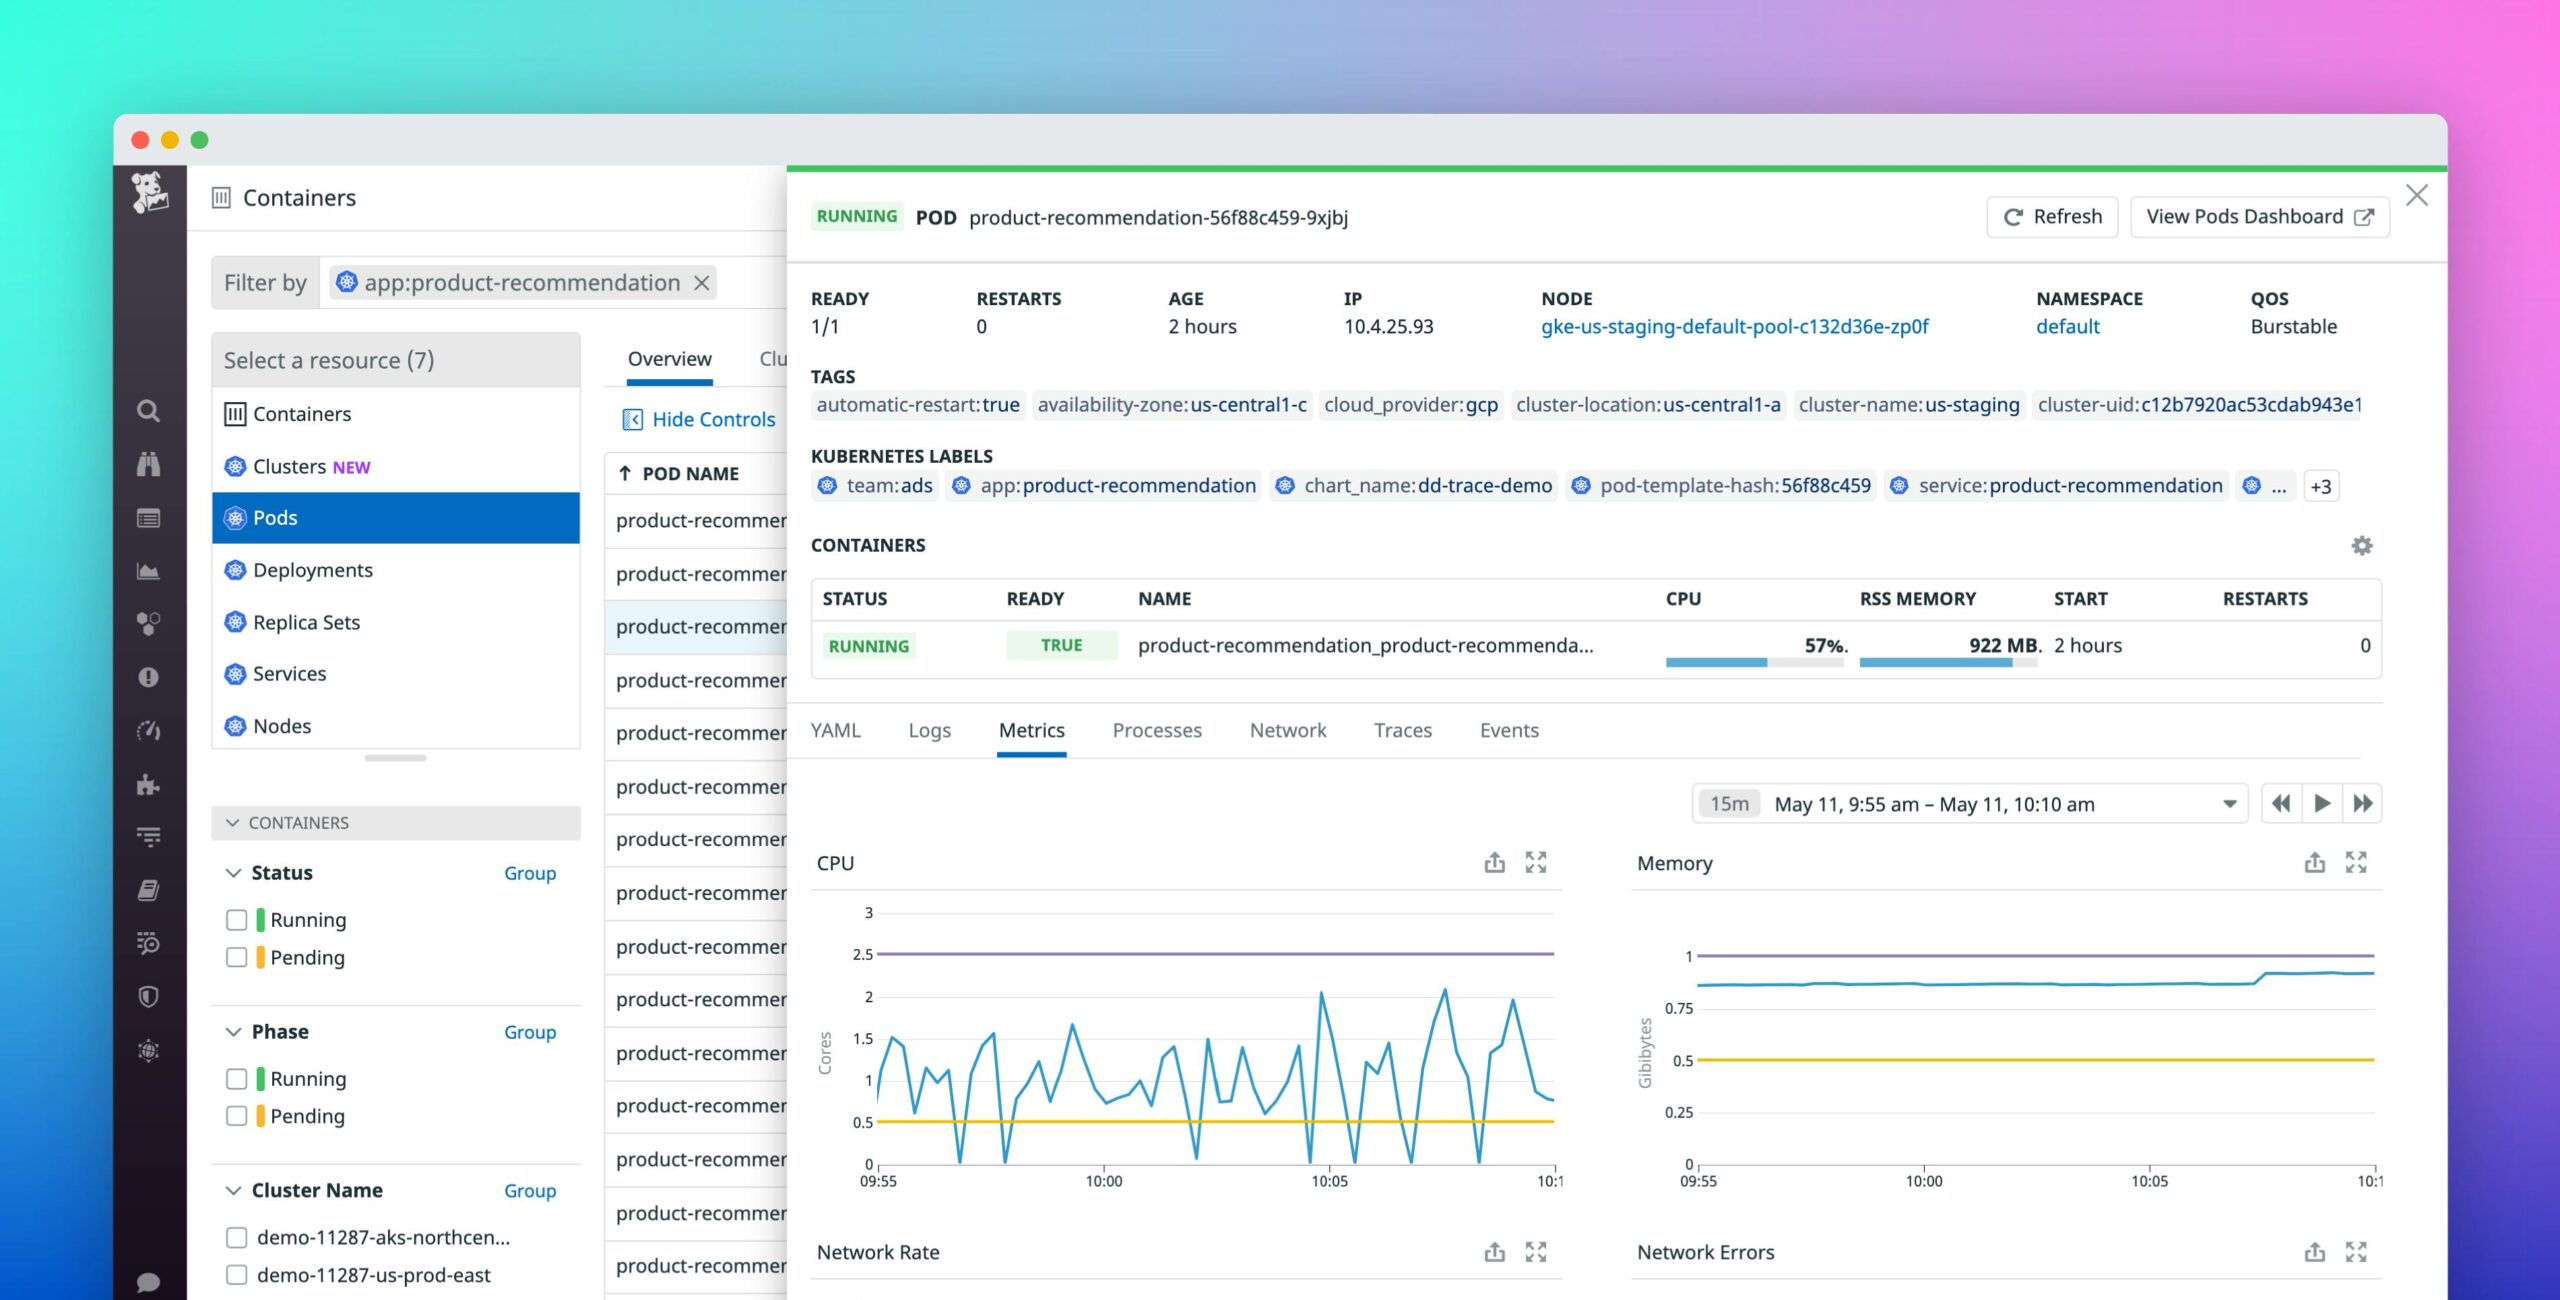
“Explore Kubernetes Resources With …” from www.datadoghq.com and used with no modifications.
Common Critical Issues in Kubernetes
Pod Failures and CrashLoopBackOff States
Pod failures are one of the most common issues in Kubernetes. When a pod fails, it can enter a CrashLoopBackOff state, where it continuously crashes and restarts. This can be caused by various factors, such as application bugs, resource limitations, or misconfigurations.
To prevent pod failures, you should consider mastering Kubernetes logs for effective troubleshooting.
Monitor pod health and performance metrics
Set up alerts for CrashLoopBackOff states
Investigate and resolve the root cause of failures
Node Resource Limitations and Exhaustion
Nodes in a Kubernetes cluster have finite resources, such as CPU and memory. If these resources are exhausted, it can lead to performance degradation and application crashes. Monitoring node resource usage is crucial to prevent this issue.
Key steps to manage node resources include monitoring and optimizing resource usage. For a detailed guide on Kubernetes cost optimization, check out this Kubernetes cost optimization on AWS EKS.
Regularly monitor CPU and memory usage
Set resource requests and limits for your pods
Scale your cluster by adding more nodes when necessary
Networking and Connectivity Issues
Networking is a critical component of Kubernetes, and any issues can lead to service disruptions. Common networking problems include DNS resolution failures, network partitioning, and connectivity issues between pods and services.
To mitigate networking issues, you should consider implementing some proactive monitoring such as:
Monitor network latency and throughput
Set up alerts for network errors and timeouts
Ensure proper network configuration and routing
Service Downtime and Latency
Service downtime and latency can significantly impact user experience. These issues can be caused by various factors, including resource exhaustion, network problems, and application bugs. Monitoring service performance is essential to maintain high availability and low latency.
To prevent service downtime and latency, you should:
Monitor service health and response times
Set up alerts for high latency and downtime
Implement auto-scaling to handle increased load
Leveraging Datadog for Proactive Monitoring
Datadog provides a range of tools to help you proactively monitor your Kubernetes environment. By integrating Datadog with your cluster, you can automate monitoring and quickly respond to potential issues.
Setting Up Datadog in Your Kubernetes Cluster
To get started with Datadog, you need to install the Datadog Agent in your Kubernetes cluster. The Datadog Agent collects metrics, logs, and traces from your applications and infrastructure, providing full visibility into your environment.
Here’s a high-level overview of the setup process:
Sign up for a Datadog account
Install the Datadog Agent using Helm or a Kubernetes manifest
Configure the Datadog Agent with your API key
Verify that the Agent is collecting metrics and logs
Using Datadog Operator and DatadogMonitor CRD
The Datadog Operator enables you to automate the deployment and management of Datadog Agents in your Kubernetes cluster. This operator simplifies the process of integrating Datadog with Kubernetes, making it easier to monitor your applications and infrastructure. The DatadogMonitor CRD extends the functionality of the Datadog Operator by allowing you to define custom monitoring rules directly within your Kubernetes manifests.
To use the Datadog Operator, you first need to install it in your cluster. Once installed, you can create DatadogMonitor resources to define the monitoring rules for your Kubernetes objects. This approach ensures that your monitoring configuration is versioned and managed alongside your application code, making it easier to maintain and update. For more details on monitoring, check out this guide on monitoring Kubernetes with Prometheus and Grafana.
Creating Custom Alerts with Datadog
Custom alerts are crucial for proactive monitoring because they allow you to define specific conditions under which you want to be notified. With Datadog, you can create custom alerts for various metrics, such as CPU usage, memory consumption, and network latency. These alerts help you quickly identify and respond to potential issues before they impact your applications.
To create a custom alert in Datadog, follow these steps:
Navigate to the Monitors section in the Datadog dashboard
Click on the “New Monitor” button
Select the type of monitor you want to create (e.g., metric, log, APM)
Define the alert conditions and thresholds
Set up notification channels (e.g., email, Slack, PagerDuty)
Save and activate the monitor
By setting up custom alerts, you can ensure that you are notified of any issues that require immediate attention, allowing you to take corrective action before they escalate.
Integrating Datadog with Existing Instrumented Services
Datadog integrates seamlessly with a wide range of services and tools, making it easy to incorporate into your existing monitoring setup. Whether you are using cloud services like AWS, Google Cloud, or Azure, or on-premises solutions, Datadog provides integrations that allow you to collect and visualize metrics, logs, and traces from your entire stack.
To integrate Datadog with your existing services, you can use the following methods:
Install the Datadog Agent on your servers and configure it to collect metrics and logs
Use Datadog’s API to send custom metrics and events
Leverage built-in integrations for popular services and tools
Utilize Datadog’s tracing library to instrument your applications for APM
By integrating Datadog with your existing instrumented services, you can gain comprehensive visibility into your entire infrastructure and applications, enabling you to quickly identify and resolve issues. For more insights, read our guide on troubleshooting Kubernetes ingress issues.
Practical Implementation Steps
Implementing proactive monitoring with Datadog involves several steps, from installing the Datadog Operator to creating custom alerts and integrating with existing services. The following sections provide detailed instructions to help you get started.
Step-by-Step Guide to Installing Datadog Operator
To install the Datadog Operator in your Kubernetes cluster, follow these steps:
Ensure you have Helm installed on your local machine
Add the Datadog Helm repository:
helm repo add datadog https://helm.datadoghq.comUpdate your Helm repositories:
helm repo updateInstall the Datadog Operator:
helm install datadog-operator datadog/datadog-operatorVerify the installation:
kubectl get pods -n datadog
Once the Datadog Operator is installed, you can start creating DatadogMonitor resources to define your monitoring rules.
Example of a DatadogMonitor Deployment Specification
Here is an example of a DatadogMonitor deployment specification:
apiVersion: datadoghq.com/v1alpha1kind: DatadogMonitor
metadata:
  name: cpu-usage-monitor
  namespace: default
spec:
  query: "avg(last_5m):avg:kubernetes.cpu.usage.total{*} by {pod} > 80"
  type: "metric alert"
  message: "High CPU usage detected on pod {{pod.name}}"
  options:
    thresholds:
      critical: 80
    notify_no_data: false
    renotify_interval: 10
This example defines a monitor that alerts when the average CPU usage of a pod exceeds 80% over the last 5 minutes. You can customize the query, thresholds, and notification settings to suit your needs.
Deploying and Managing Datadog Monitors with kubectl
To deploy and manage Datadog monitors using kubectl, follow these steps:
Create a YAML file with the DatadogMonitor specification
Apply the YAML file to your cluster:
kubectl apply -f cpu-usage-monitor.yamlVerify the monitor is created:
kubectl get datadogmonitor -n defaultUpdate the monitor by modifying the YAML file and reapplying it
Delete the monitor if no longer needed:
kubectl delete datadogmonitor cpu-usage-monitor -n default
By using kubectl to manage your Datadog monitors, you can easily version and automate your monitoring configuration as part of your Kubernetes deployment process.
Case Study: Success Stories
Several companies have successfully implemented Datadog for proactive monitoring in their Kubernetes environments. These case studies highlight the benefits of using Datadog to prevent critical issues and improve overall performance.
Improved Uptime with Datadog
A leading e-commerce platform struggled with frequent service outages due to pod failures and resource exhaustion. By implementing Datadog and setting up custom alerts, they were able to identify and resolve issues before they impacted their customers. As a result, they achieved a 99.9% uptime, significantly improving their customer experience.
Faster Issue Resolution Using Datadog
A financial services provider faced challenges with slow issue resolution due to a lack of visibility into their Kubernetes environment. After integrating Datadog, they gained comprehensive insights into their applications and infrastructure. This enabled their DevOps team to quickly identify and resolve issues, reducing their mean time to resolution (MTTR) by 50%.
Enhanced Performance Visibility and Optimization
A SaaS company needed better visibility into their application’s performance to optimize resource usage and reduce costs. By using Datadog’s monitoring and APM capabilities, they were able to identify performance bottlenecks and optimize their application. This led to a 30% reduction in infrastructure costs and improved application performance.
Final Thoughts on Proactive Kubernetes Monitoring
Proactive monitoring is essential for maintaining the stability and performance of your Kubernetes environment. By leveraging Datadog’s comprehensive monitoring tools, you can stay ahead of potential issues and ensure smooth operations for your applications.
Continuous improvement and monitoring strategies are key to long-term success. As your applications and infrastructure evolve, it’s important to regularly review and update your monitoring configuration to address new challenges and optimize performance. If your business is not ready for a tool like Datadog, consider monitoring Kubernetes with Prometheus and Grafana to enhance your observability stack.
Continuous Improvement and Monitoring Strategies
Continuous improvement in monitoring strategies involves regularly assessing your monitoring setup and making necessary adjustments. This might include refining alert thresholds, adding new monitors for emerging issues, and leveraging proactive monitoring insights provided by Datadog to identify patterns and anomalies.
Additionally, integrating feedback from your DevOps team and end-users can help fine-tune your monitoring configuration, ensuring it remains effective and relevant as your system grows and changes.
The Future of Kubernetes Monitoring with Datadog
The future of Kubernetes monitoring is likely to see even greater automation and intelligence. Datadog is continuously enhancing its capabilities, incorporating advanced machine learning algorithms to provide predictive insights and automated anomaly detection.
As Kubernetes environments become more complex, the need for sophisticated monitoring tools will only increase. Datadog’s ongoing innovations will help you stay ahead of the curve, ensuring your applications remain reliable and performant.
Frequently Asked Questions (FAQ)
How does Datadog help in preventing Kubernetes issues?
Datadog helps prevent Kubernetes issues by providing real-time monitoring and alerting for your entire Kubernetes environment. It collects and visualizes metrics, logs, and traces, giving you comprehensive insights into the health and performance of your applications and infrastructure.
With custom alerts, you can set specific conditions for when you want to be notified, allowing you to address potential issues before they escalate. Datadog’s machine learning capabilities also help identify patterns and anomalies, providing early warnings for potential problems.
What are the benefits of using Datadog Operator?
The Datadog Operator simplifies the deployment and management of Datadog Agents in your Kubernetes cluster. It automates the process of integrating Datadog with Kubernetes, making it easier to monitor your applications and infrastructure.
By using the DatadogMonitor CRD, you can define monitoring rules directly within your Kubernetes manifests, ensuring that your monitoring configuration is versioned and managed alongside your application code.
Can Datadog monitor both on-premises and cloud-based Kubernetes clusters?
Yes, Datadog can monitor both on-premises and cloud-based Kubernetes clusters. It provides integrations for various cloud providers, including AWS, Google Cloud, and Azure, as well as support for on-premises environments.
This flexibility allows you to gain comprehensive visibility into your entire infrastructure, regardless of where it is hosted.
How easy is it to set up custom alerts with Datadog?
Setting up custom alerts with Datadog is straightforward. The Datadog dashboard provides an intuitive interface for creating and managing monitors. You can define alert conditions based on various metrics, such as CPU usage, memory consumption, and network latency.
Datadog also offers extensive documentation and support to help you get started with custom alerts, ensuring you can quickly set up effective monitoring for your applications.
What kind of data does Datadog provide for Kubernetes monitoring?
Datadog provides a wide range of data for Kubernetes monitoring, including metrics, logs, and traces. Metrics cover various aspects of your Kubernetes environment, such as pod health, node resource usage, and network performance.
Logs provide detailed information about events and errors, helping you troubleshoot issues. Traces give you insights into the performance of your applications, allowing you to identify and resolve performance bottlenecks.
By combining these different types of data, Datadog offers comprehensive visibility into your Kubernetes environment, enabling you to proactively monitor and manage your applications and infrastructure.


