Key Takeaways
Datadog provides real-time visibility into the health and performance of your Kubernetes cluster.
Installing the Datadog Agent and Cluster Agent is essential for comprehensive monitoring.
Monitoring key metrics like cluster health, node resource utilization, and application performance helps optimize Kubernetes operations.
Customizable dashboards and alerting features in Datadog make it easier to manage Kubernetes environments.
Effective Kubernetes monitoring with Datadog can lead to improved performance, reduced downtime, and efficient resource management.
Using Datadog for Effective Kubernetes Monitoring and Troubleshooting
Monitoring your Kubernetes cluster is crucial for ensuring its optimal performance, availability, and reliability. With Datadog, you can gain real-time visibility into the health and performance of your cluster, including metrics, logs, and traces. This article will guide you through using Datadog to enhance your Kubernetes monitoring and troubleshooting capabilities.
Why Effective Monitoring Matters
Effective monitoring is essential because Kubernetes environments can be complex and dynamic. Without proper monitoring, identifying and resolving issues can be challenging, leading to potential downtime and performance degradation. By using Datadog, you can proactively monitor your Kubernetes cluster and quickly address any issues that arise.

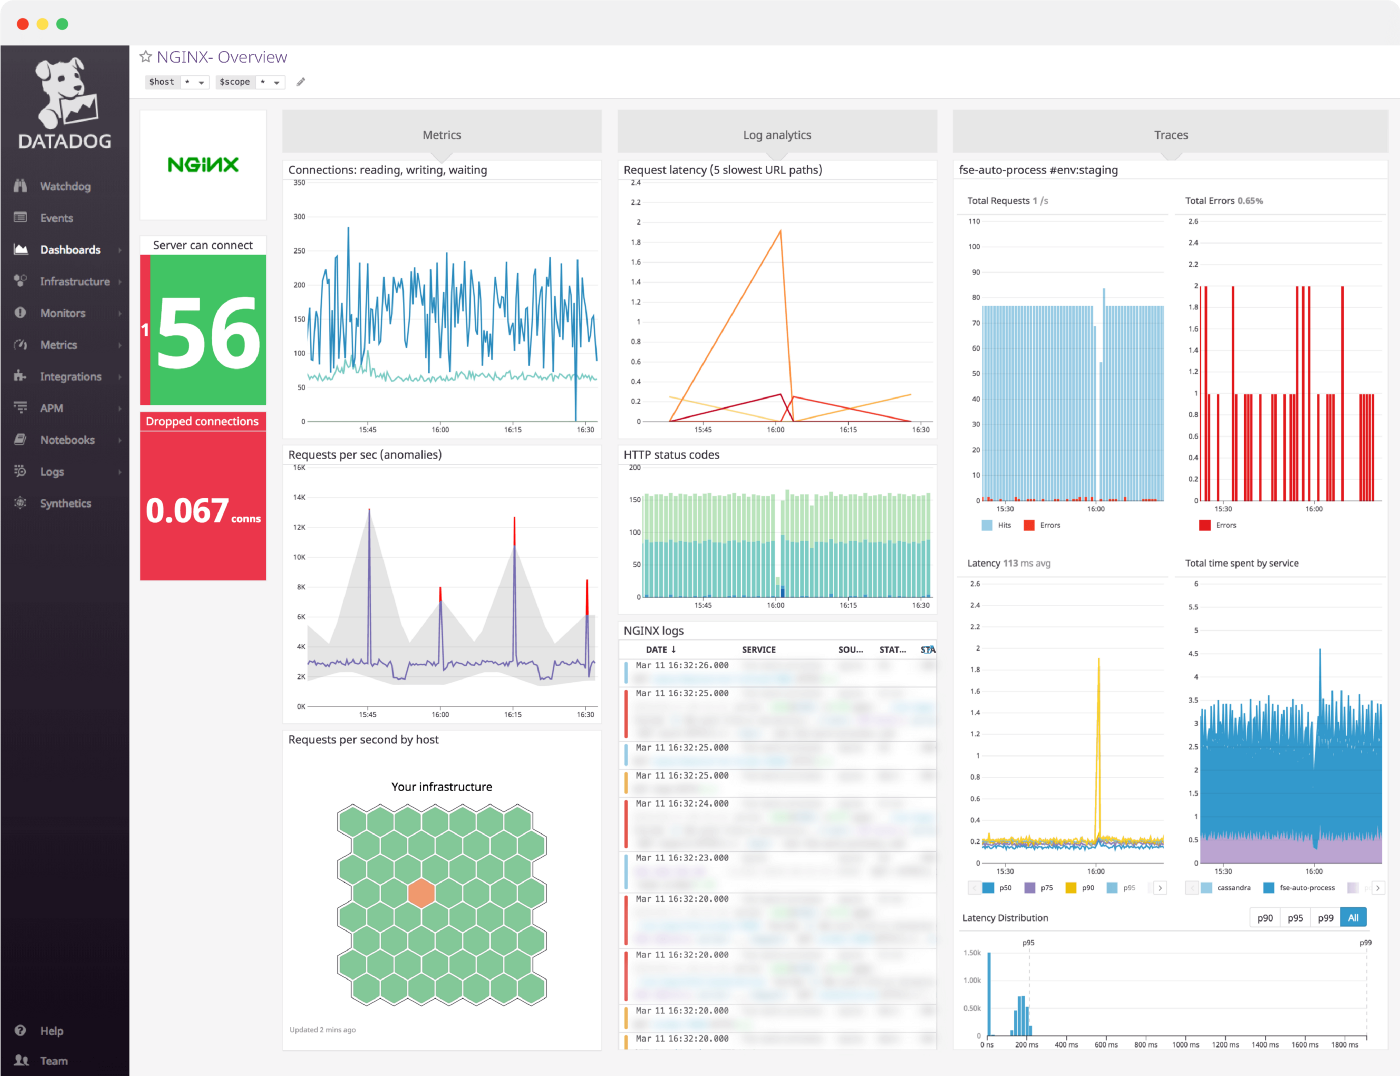
“Datadog | Cloud Monitoring. Datadog …” from medium.com and used with no modifications.
Getting Started with Datadog for Kubernetes
To get started with Datadog for Kubernetes, you’ll need to install the Datadog Agent and set up the Datadog Cluster Agent. These components will collect key metrics and events from your Kubernetes cluster and send them to Datadog for analysis.
Installing Datadog Agent on Your Kubernetes Cluster
First, you’ll need to install the Datadog Agent on your Kubernetes cluster. The Datadog Agent is a lightweight daemon that collects metrics, logs, and traces from your cluster and sends them to Datadog. Follow these steps to install the Datadog Agent:
For additional insights on monitoring, you might find this in-depth guide to Prometheus useful.
Create a Datadog account and obtain an API key.
Deploy the Datadog Agent as a DaemonSet in your Kubernetes cluster using the following command:
kubectl apply -f https://raw.githubusercontent.com/DataDog/datadog-agent/master/Dockerfiles/manifests/rbac/cluster-agent-all.yamlVerify that the Datadog Agent is running on all nodes in your cluster by using the command:
kubectl get daemonset datadog-agent -n datadog
Setting Up Datadog Cluster Agent
Next, you’ll need to set up the Datadog Cluster Agent. The Cluster Agent provides cluster-level metrics and events, making it easier to monitor and troubleshoot your Kubernetes environment. Follow these steps to set up the Datadog Cluster Agent:
Deploy the Datadog Cluster Agent using the following command:
kubectl apply -f https://raw.githubusercontent.com/DataDog/datadog-agent/master/Dockerfiles/manifests/cluster-agent/cluster-agent-all.yamlVerify that the Datadog Cluster Agent is running by using the command:
kubectl get deployment datadog-cluster-agent -n datadog
Integrating Kubernetes with Datadog
Once the Datadog Agent and Cluster Agent are installed, you’ll need to integrate your Kubernetes cluster with Datadog. This integration will allow Datadog to collect and visualize metrics from your cluster. Follow these steps to integrate Kubernetes with Datadog:
Configure the Datadog Agent to collect Kubernetes metrics by editing the datadog-agent.yaml file and enabling the Kubernetes integration.
Deploy the updated configuration using the command:
kubectl apply -f datadog-agent.yamlVerify that the Kubernetes metrics are being collected by checking the Datadog dashboard.
Utilizing Datadog’s Features for Effective Monitoring
Datadog offers a variety of features that make monitoring your Kubernetes cluster more efficient and effective. These features include customizable dashboards, alerting mechanisms, log management, and application performance monitoring (APM). Let’s explore how you can leverage these features to enhance your Kubernetes monitoring.
Dashboard Customization
One of the most powerful features of Datadog is its customizable dashboards. These dashboards allow you to visualize key metrics and gain insights into your Kubernetes cluster’s performance. You can create custom widgets to display specific metrics, set up time-series graphs, and even integrate data from other sources.
For example, you can create a dashboard to monitor CPU and memory usage across all nodes in your cluster. This helps you identify resource bottlenecks and optimize resource allocation. Here’s a sample dashboard configuration:
  {    "title": "Kubernetes Cluster Overview",
    "widgets": [
      {
        "type": "timeseries",
        "requests": [
          {
            "q": "avg:kubernetes.cpu.usage.total{*} by {node}",
            "display_type": "line"
          }
        ],
        "title": "CPU Usage by Node"
      },
      {
        "type": "timeseries",
        "requests": [
          {
            "q": "avg:kubernetes.memory.usage.total{*} by {node}",
            "display_type": "line"
          }
        ],
        "title": "Memory Usage by Node"
      }
    ],
    "layout_type": "ordered"
  }
Setting Up Alerts and Notifications
Besides visualizing metrics, setting up alerts and notifications is crucial for proactive monitoring. Datadog allows you to create custom alerts based on specific conditions, such as high CPU usage or memory consumption. When these conditions are met, Datadog can send notifications via email, Slack, or other communication channels.
To set up an alert, follow these steps:
Navigate to the “Monitors” section in Datadog.
Click on “New Monitor” and select the type of monitor you want to create (e.g., metric monitor).
Define the alert conditions, such as CPU usage > 80% for more than 5 minutes.
Configure the notification settings, including the recipients and message format.
Save the monitor and activate it.
By setting up alerts, you can ensure that you’re notified of potential issues before they escalate, allowing you to take corrective action promptly.
Using Log Management Effectively
Log management is another essential aspect of monitoring Kubernetes clusters. Datadog’s log management features enable you to collect, analyze, and visualize logs from your cluster. This helps you identify patterns, troubleshoot issues, and gain insights into application performance.
To use Datadog’s log management effectively, follow these steps:
Enable log collection in the Datadog Agent configuration by setting the
logs_enabledparameter totrue.Configure log sources, such as container logs and application logs, in the
datadog.yamlfile.Deploy the updated configuration to your Kubernetes cluster.
Use the Datadog dashboard to visualize and analyze the collected logs.
Effective log management can help you quickly identify and resolve issues, ensuring the smooth operation of your Kubernetes cluster.
Leveraging APM for Tracing and Troubleshooting
Application Performance Monitoring (APM) is a powerful feature in Datadog that allows you to trace and troubleshoot application performance issues. APM provides end-to-end visibility into your application’s performance, from frontend requests to backend services.
To leverage APM for tracing and troubleshooting, follow these steps:
Instrument your application code with Datadog’s APM libraries.
Deploy the instrumented application to your Kubernetes cluster.
Use the Datadog APM dashboard to visualize traces and identify performance bottlenecks.
Analyze the traces to pinpoint the root cause of performance issues.
By leveraging APM, you can gain deep insights into your application’s performance and quickly resolve any issues that arise.
Optimizing Resource Utilization in Kubernetes with Datadog
Optimizing resource utilization is essential for maintaining the performance and efficiency of your Kubernetes cluster. Datadog provides several tools and features to help you monitor and optimize resource usage.
Monitoring CPU and Memory Usage
Monitoring CPU and memory usage is critical for understanding how your cluster’s resources are being utilized. Datadog allows you to collect and visualize CPU and memory metrics for your nodes and pods.
To monitor CPU and memory usage, follow these steps:
Ensure that the Datadog Agent is configured to collect CPU and memory metrics.
Create a dashboard in Datadog to visualize CPU and memory usage across your cluster.
Set up alerts to notify you of high CPU or memory usage.
By monitoring CPU and memory usage, you can identify resource bottlenecks and take corrective action to optimize resource utilization.
Adjusting Resource Limits and Requests
Adjusting resource limits and requests is another important aspect of optimizing resource utilization. Kubernetes allows you to specify resource limits and requests for your pods, ensuring that they have the necessary resources to run efficiently.
To adjust resource limits and requests, follow these steps:
Analyze the CPU and memory usage metrics collected by Datadog.
Identify pods that are overutilizing or underutilizing resources.
Update the resource limits and requests for these pods in their deployment configurations.
Deploy the updated configurations to your Kubernetes cluster.
By adjusting resource limits and requests, you can ensure that your pods have the necessary resources to run efficiently, preventing resource contention and improving overall performance. For more insights, check out this in-depth guide to Prometheus.
Scaling Applications Based on Metrics
Scaling applications based on metrics is a key strategy for optimizing resource utilization in Kubernetes. Datadog allows you to set up autoscaling policies based on CPU and memory usage metrics, ensuring that your applications can scale up or down as needed.
To set up autoscaling based on metrics, follow these steps:
First, ensure that your Kubernetes cluster is properly configured.
Configure the Horizontal Pod Autoscaler (HPA) in Kubernetes to use CPU or memory metrics collected by Datadog.
Define the scaling policies, such as scaling up when CPU usage exceeds 70%.
Deploy the HPA configuration to your Kubernetes cluster.
Monitor the scaling activity using the Datadog dashboard.
By scaling applications based on metrics, you can ensure that your applications have the necessary resources to handle varying workloads, improving performance and efficiency. Learn more about solving common Kubernetes issues to enhance your deployment strategies.
Troubleshooting Kubernetes with Datadog
Troubleshooting is an essential aspect of managing Kubernetes clusters. Datadog provides several tools and features to help you identify and resolve issues quickly.
Identifying Performance Bottlenecks
Performance bottlenecks can significantly impact the performance and reliability of your Kubernetes cluster. Datadog allows you to identify performance bottlenecks by monitoring key metrics and analyzing traces.
To identify performance bottlenecks, follow these steps:
Monitor CPU and memory usage metrics to identify resource contention.
Analyze application performance traces to pinpoint slow components.
Use Datadog’s log management features to identify patterns and anomalies.
By identifying performance bottlenecks, you can take corrective action to optimize your Kubernetes cluster’s performance and reliability.
Diagnosing Network Issues
Network issues can also impact the performance and reliability of your Kubernetes cluster. Datadog provides network monitoring features that allow you to diagnose and resolve network issues.
To diagnose network issues, follow these steps:
Monitor network traffic metrics, such as packet loss and latency.
Analyze network logs to identify patterns and anomalies.
Use Datadog’s network performance monitoring features to visualize network traffic and identify bottlenecks.
By diagnosing and resolving network issues, you can ensure that your Kubernetes cluster operates smoothly and efficiently. Learn more about solving common Kubernetes issues in different environments.
Resolving Pod Failures
Pod failures can disrupt the operation of your Kubernetes cluster. Datadog provides several tools and features to help you identify and resolve pod failures quickly.
To resolve pod failures, follow these steps:
Monitor pod status metrics to identify failed pods.
Analyze pod logs to identify the root cause of the failures.
Use Datadog’s APM features to trace application performance and identify issues.
Take corrective action, such as restarting failed pods or updating deployment configurations.
By resolving pod failures quickly, you can minimize downtime and ensure the smooth operation of your Kubernetes cluster.
Case Studies: Success Stories Using Datadog
Many companies have successfully used Datadog to enhance their Kubernetes monitoring and troubleshooting capabilities. Let’s explore a few success stories.
Company A’s Improved Performance
Company A, a leading e-commerce platform, used Datadog to monitor and optimize their Kubernetes cluster. By leveraging Datadog’s features, they were able to identify and resolve performance bottlenecks, resulting in a 30% improvement in application performance.
Company B’s Reduced Downtime
Company B, a financial services provider, used Datadog to set up alerts and notifications for their Kubernetes cluster. This allowed them to proactively address issues before they escalated, reducing downtime by 40%.
Company C’s Efficient Resource Management
Company C, a SaaS provider, used Datadog to monitor and optimize resource utilization in their Kubernetes cluster. By adjusting resource limits and requests based on Datadog’s metrics, they were able to reduce their infrastructure costs by 25% while maintaining high performance.
Conclusion: Enhance Your Kubernetes Monitoring Today
In conclusion, Datadog provides a comprehensive set of tools and features to enhance your Kubernetes monitoring and troubleshooting capabilities. By leveraging these tools, you can optimize resource utilization, improve performance, and ensure the smooth operation of your Kubernetes cluster.
Summary of Key Points
Datadog provides real-time visibility into the health and performance of your Kubernetes cluster.
Installing the Datadog Agent and Cluster Agent is essential for comprehensive monitoring.
Monitoring key metrics like cluster health, node resource utilization, and application performance helps optimize Kubernetes operations.
Customizable dashboards and alerting features in Datadog make it easier to manage Kubernetes environments.
Effective Kubernetes monitoring with Datadog can lead to improved performance, reduced downtime, and efficient resource management.
Taking the Next Steps
Now that you understand how Datadog can enhance your Kubernetes monitoring and troubleshooting capabilities, it’s time to take the next steps. Start by installing the Datadog Agent and Cluster Agent on your Kubernetes cluster and setting up your dashboards and alerts.
Contact Us for More Information
If you have any questions or need further assistance, don’t hesitate to contact us. Our team of experts is here to help you get the most out of Datadog and ensure the success of your Kubernetes monitoring efforts.
Frequently Asked Questions (FAQ)
What is Kubernetes Monitoring?
Kubernetes monitoring involves tracking the health, performance, and resource utilization of a Kubernetes cluster. It helps administrators identify and resolve issues, optimize resource usage, and ensure the smooth operation of the cluster.
How Does Datadog Help with Kubernetes Monitoring?
Datadog provides a comprehensive set of tools and features for Kubernetes monitoring, including real-time metrics, customizable dashboards, alerting mechanisms, log management, and application performance monitoring (APM). These tools help administrators gain insights into their cluster’s performance and quickly address any issues.
What Metrics Should I Monitor in Kubernetes?
Key metrics to monitor in Kubernetes include cluster health metrics, node resource utilization (CPU and memory), application performance metrics, and network metrics. Monitoring these metrics helps administrators optimize resource usage and ensure the smooth operation of their cluster.
How Can Datadog Improve My Kubernetes Performance?
Datadog can improve your Kubernetes performance by providing real-time visibility into key metrics, allowing you to identify and resolve performance bottlenecks, optimize resource utilization, and proactively address issues before they escalate. By leveraging Datadog’s features, you can ensure the smooth operation and high performance of your Kubernetes cluster.
Conclusion: Enhance Your Kubernetes Monitoring Today
In conclusion, Datadog provides a comprehensive set of tools and features to enhance your Kubernetes monitoring and troubleshooting capabilities. By leveraging these tools, you can optimize resource utilization, improve performance, and ensure the smooth operation of your Kubernetes cluster.


